Visual research archive
Results gallery.
From survey experiments to the original concept figures. Browse every published image, open the full-size original, and read the assumptions behind each result.
- Unique images
- 37
- Original archive figures
- 17
- Published source paths
- 44
- Exact original assets
- 4.44 MiB
Original labels are kept intact. Captions explain the concept; interpretation details distinguish recorded results, historical assumptions, and limitations. Images are not cropped or regenerated.
Terrain survey
Reference elevation, reconstruction error, and isolated stresses.
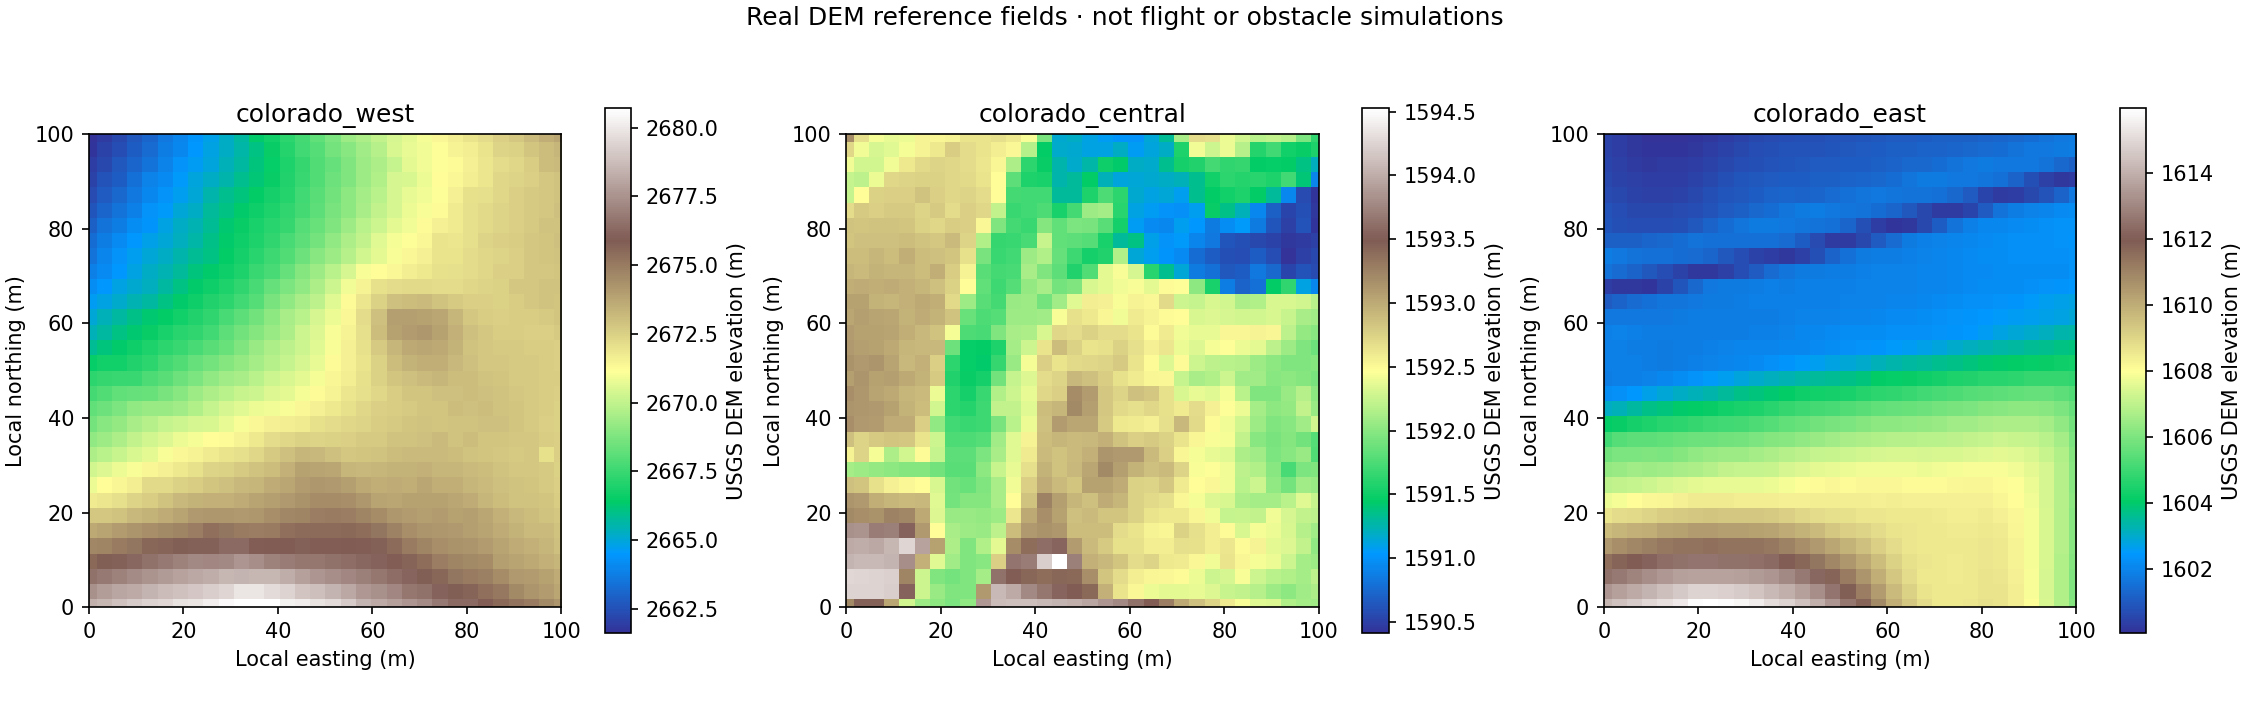
Three Colorado reference fields
Downloaded elevation patches supply the scalar survey reference, not the drone result.
Interpretation & provenance for Three Colorado reference fields
Metres, north up and east right; each panel has its own colour scale. These small smoothed DEM patches are not an obstacle or hazard model. Initial and final publications repeat the same cases, not additional independent samples.
Byte-identical source aliases
One image is shown for these exact-byte copies. They do not add independent experimental evidence.
reports/terrain_local/terrain_fields.pngreports/terrain_initial/terrain_fields.png
SHA-256 · original and download
392d51e0231f0e78f45a09960a3ce4e9f90e75f19e0eb48842b1a252e6a6a7f5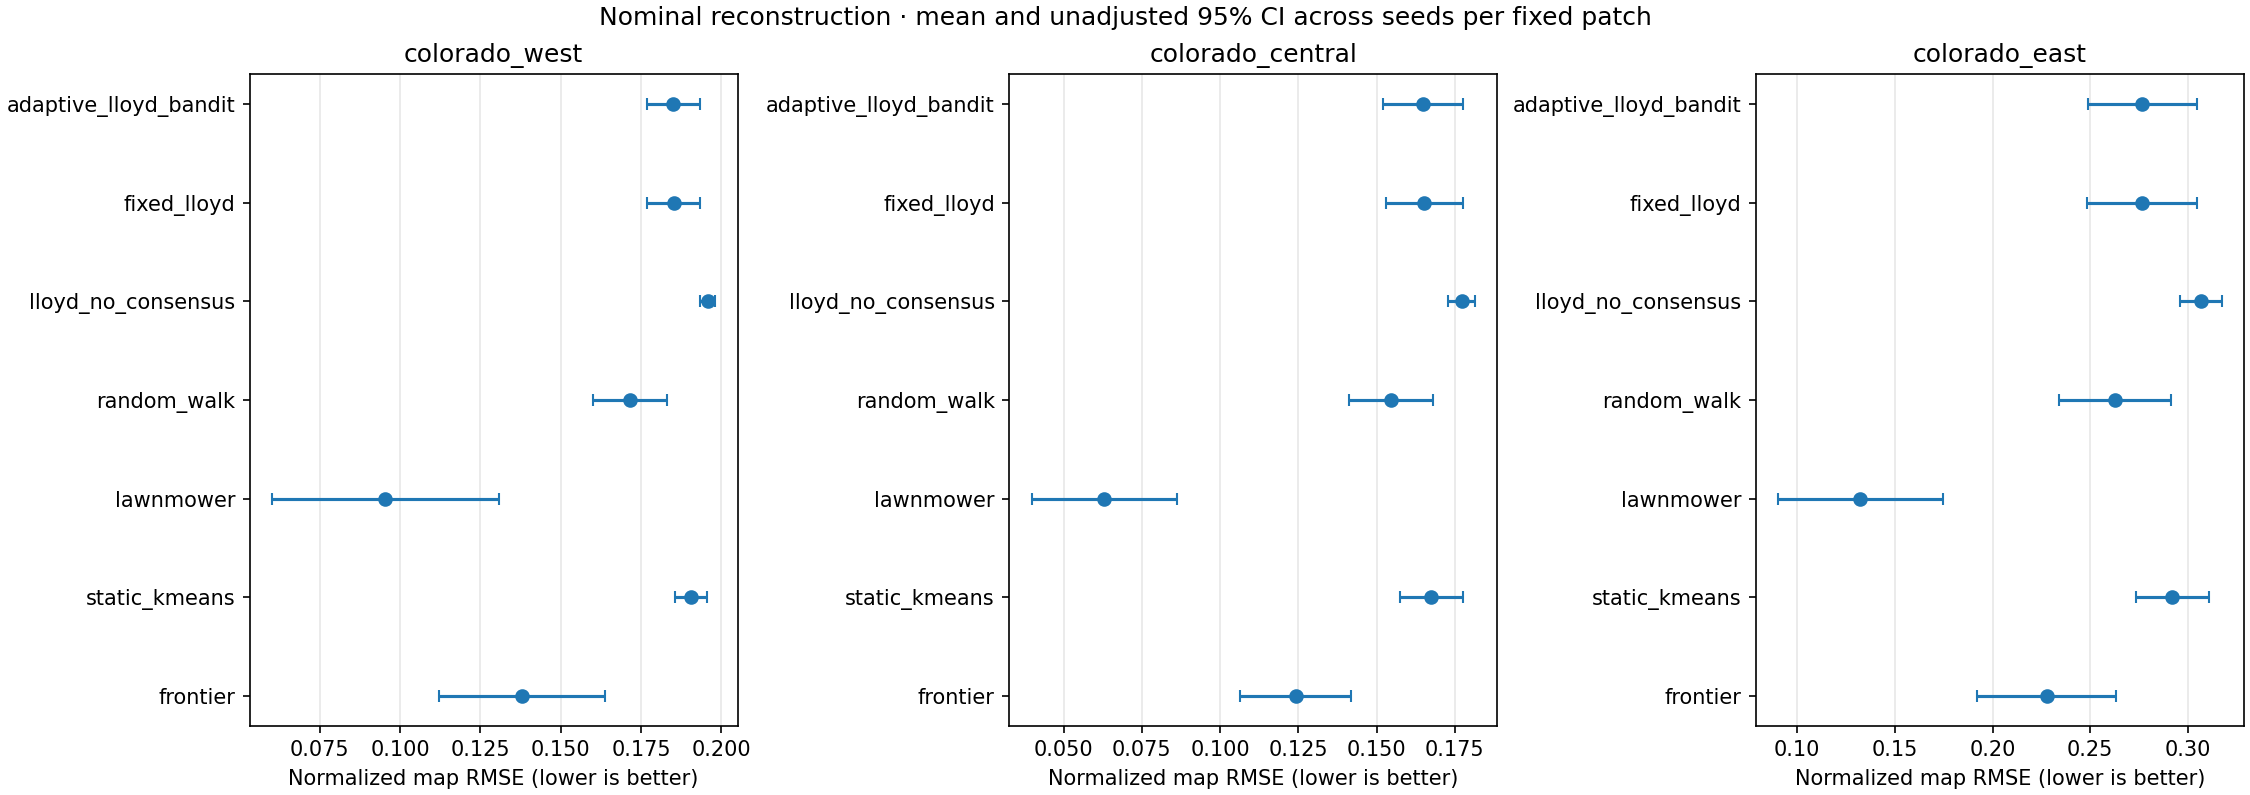
Nominal reconstruction error
Systematic sweeping has the lowest mean normalized map error on these three fixed patches.
Interpretation & provenance for Nominal reconstruction error
Horizontal whiskers are unadjusted 95% intervals over eight seeds per patch, not sensor-accuracy bounds. Formal comparisons use paired differences. Lawnmower separation failures remain: better reconstruction does not imply safe motion. The initial copy is a development rerun, not extra evidence.
Byte-identical source aliases
One image is shown for these exact-byte copies. They do not add independent experimental evidence.
reports/terrain_local/nominal_comparison.pngreports/terrain_initial/nominal_comparison.png
SHA-256 · original and download
a767e411ee4ed581c895a38aabaaf18bafb7ed7c982ac7fcc41d4a37782aa1f3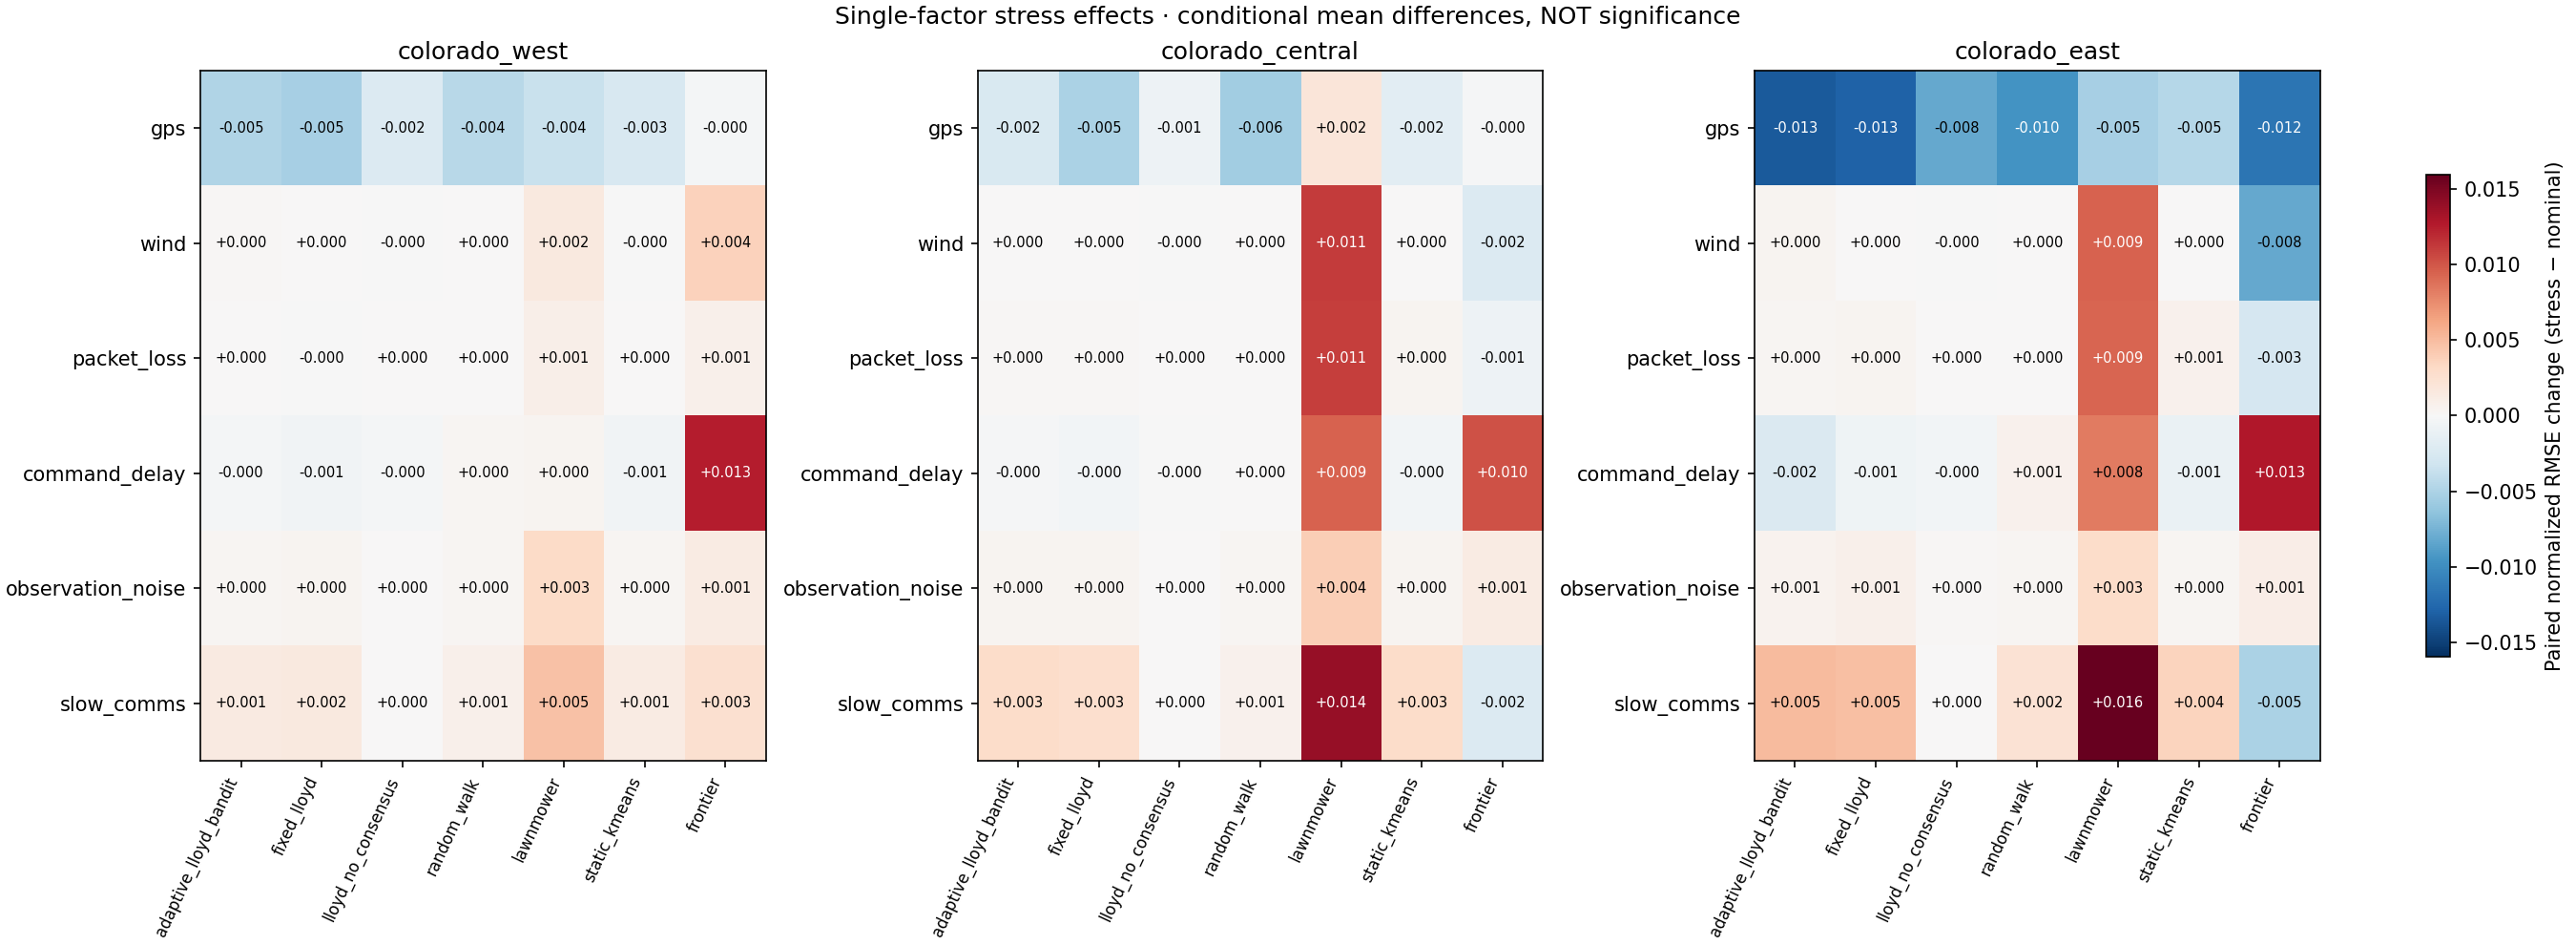
Isolated stress effects
Heatmaps show matched-seed stressed minus nominal RMSE for each policy and patch.
Interpretation & provenance for Isolated stress effects
Positive means higher error; negative means lower error. Colours show mean magnitudes, not significance. Eight-seed descriptive intervals can span zero, and near-zero means can hide failures. Stresses are one-factor changes, not measured aircraft conditions or a stress-interaction study. Initial/local images are duplicate publications.
Byte-identical source aliases
One image is shown for these exact-byte copies. They do not add independent experimental evidence.
reports/terrain_local/stress_effects.pngreports/terrain_initial/stress_effects.png
SHA-256 · original and download
2dc39b020655f980ac6b56b884ab4a01829c36e0b4f015534f25400a01821f54Paired separation
Projected versus legacy motion on matched synthetic fields.
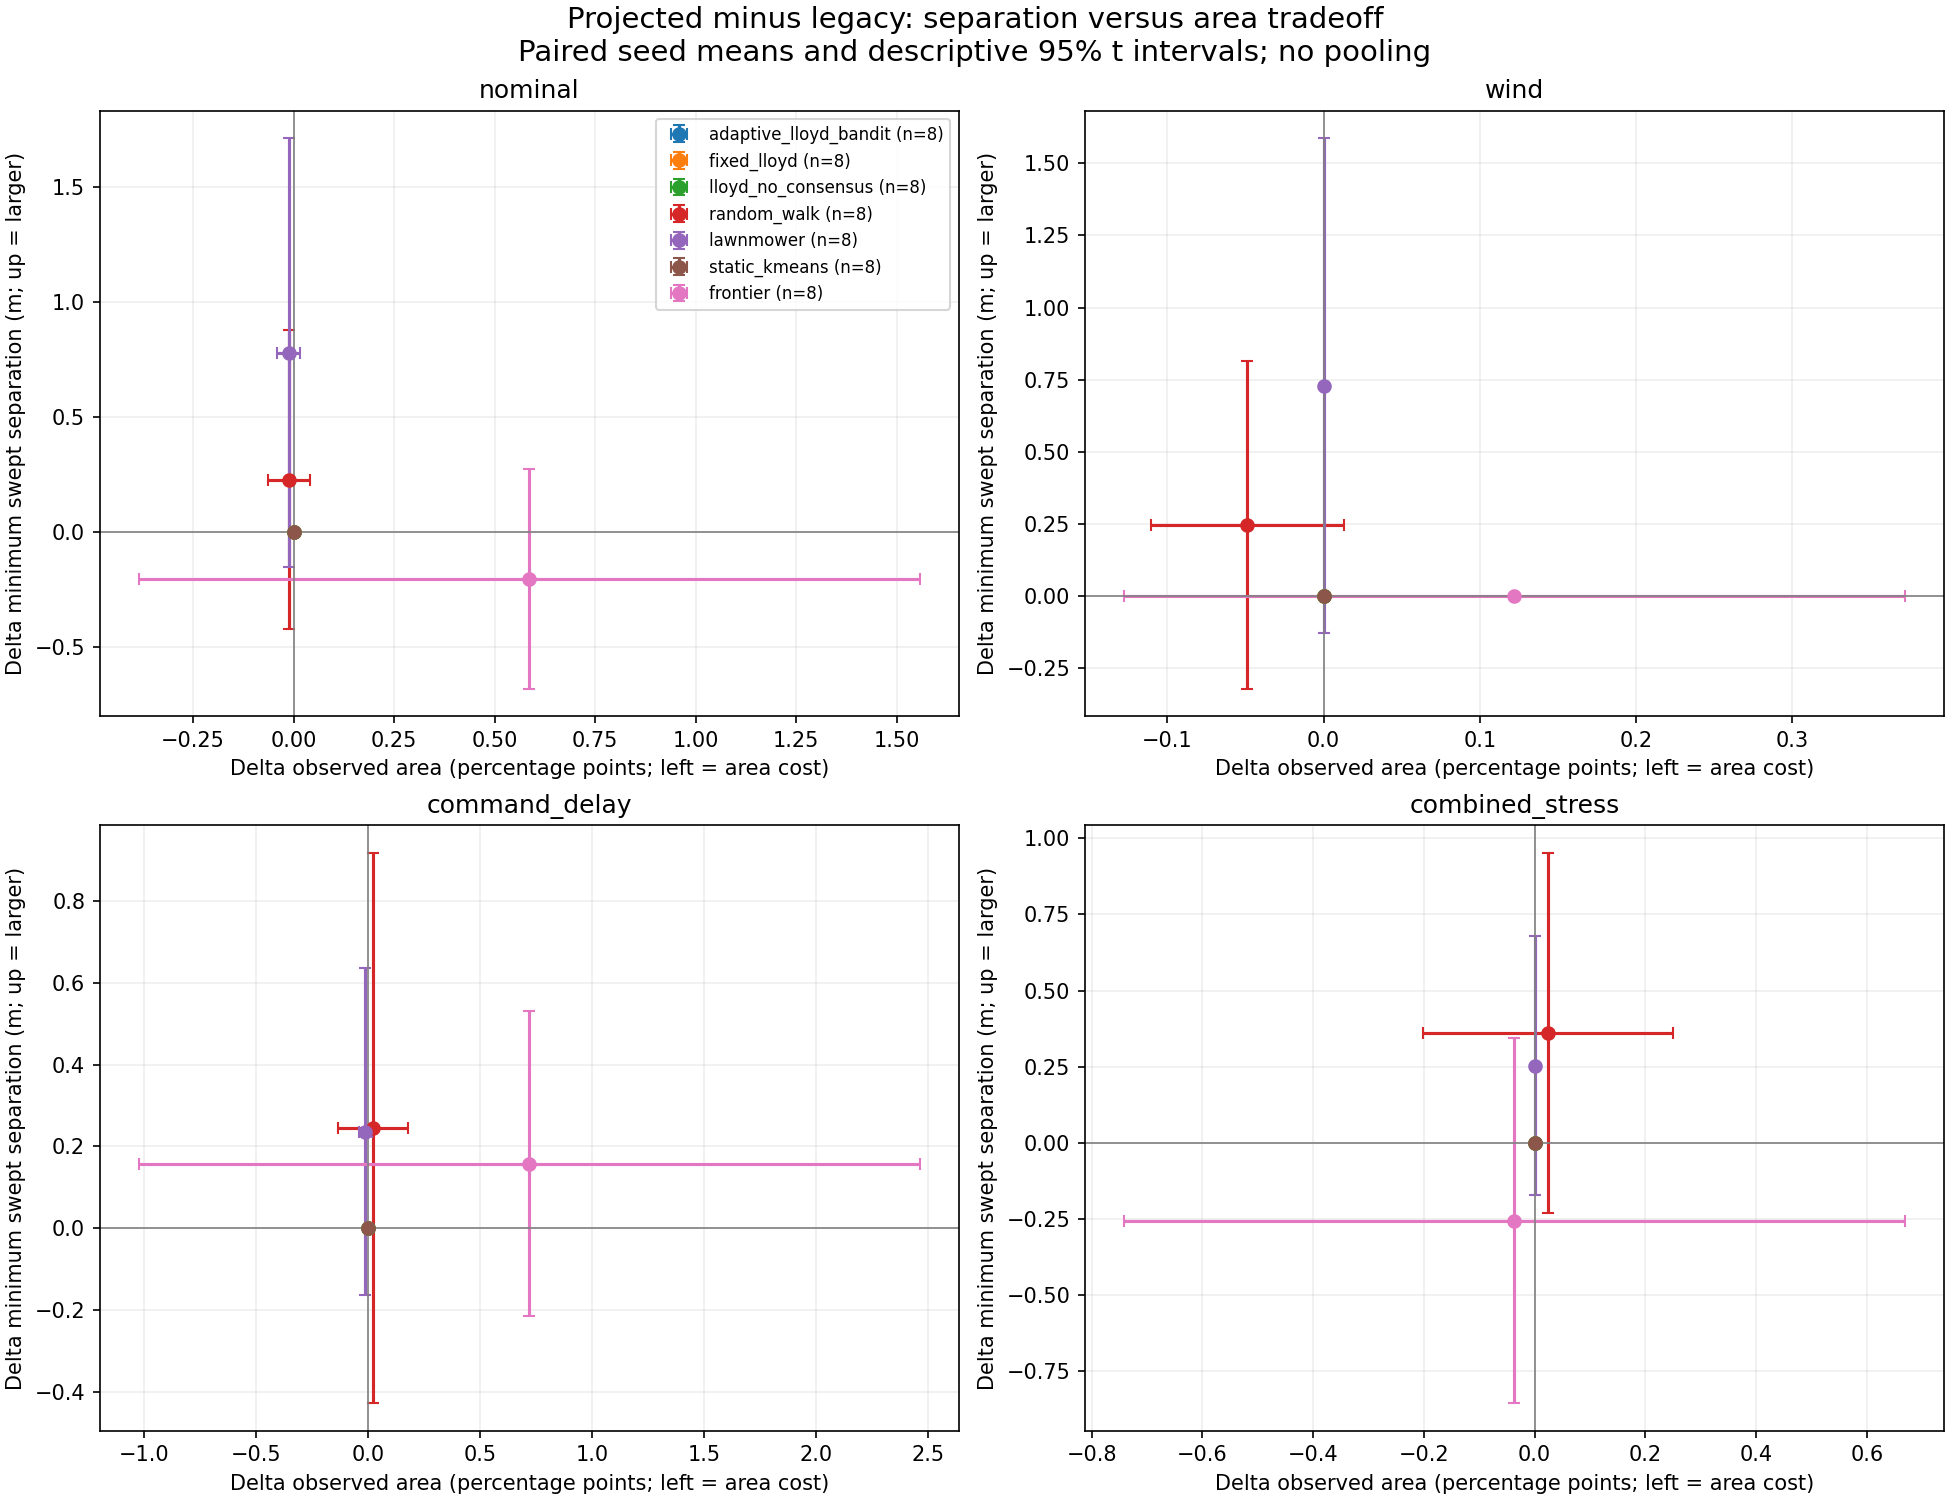
Separation and observed-area trade-offs
Paired projected-minus-legacy differences relate minimum separation to physically observed area.
Interpretation & provenance for Separation and observed-area trade-offs
Eight paired seeds per policy and condition; 95% Student-t intervals are small-sample descriptive summaries, not a pooled superiority test. Overlapping marks at zero are retained. Projection uses centralized true state and current wind; ten uncertified steps remain despite zero audited projected collisions.
Original source file
reports/separation_local/main/paired_separation_area.png
SHA-256 · original and download
50d4e0b2e7617274845c4347e11750b9b60e65aedabfcf9c65fb2a89825c6c38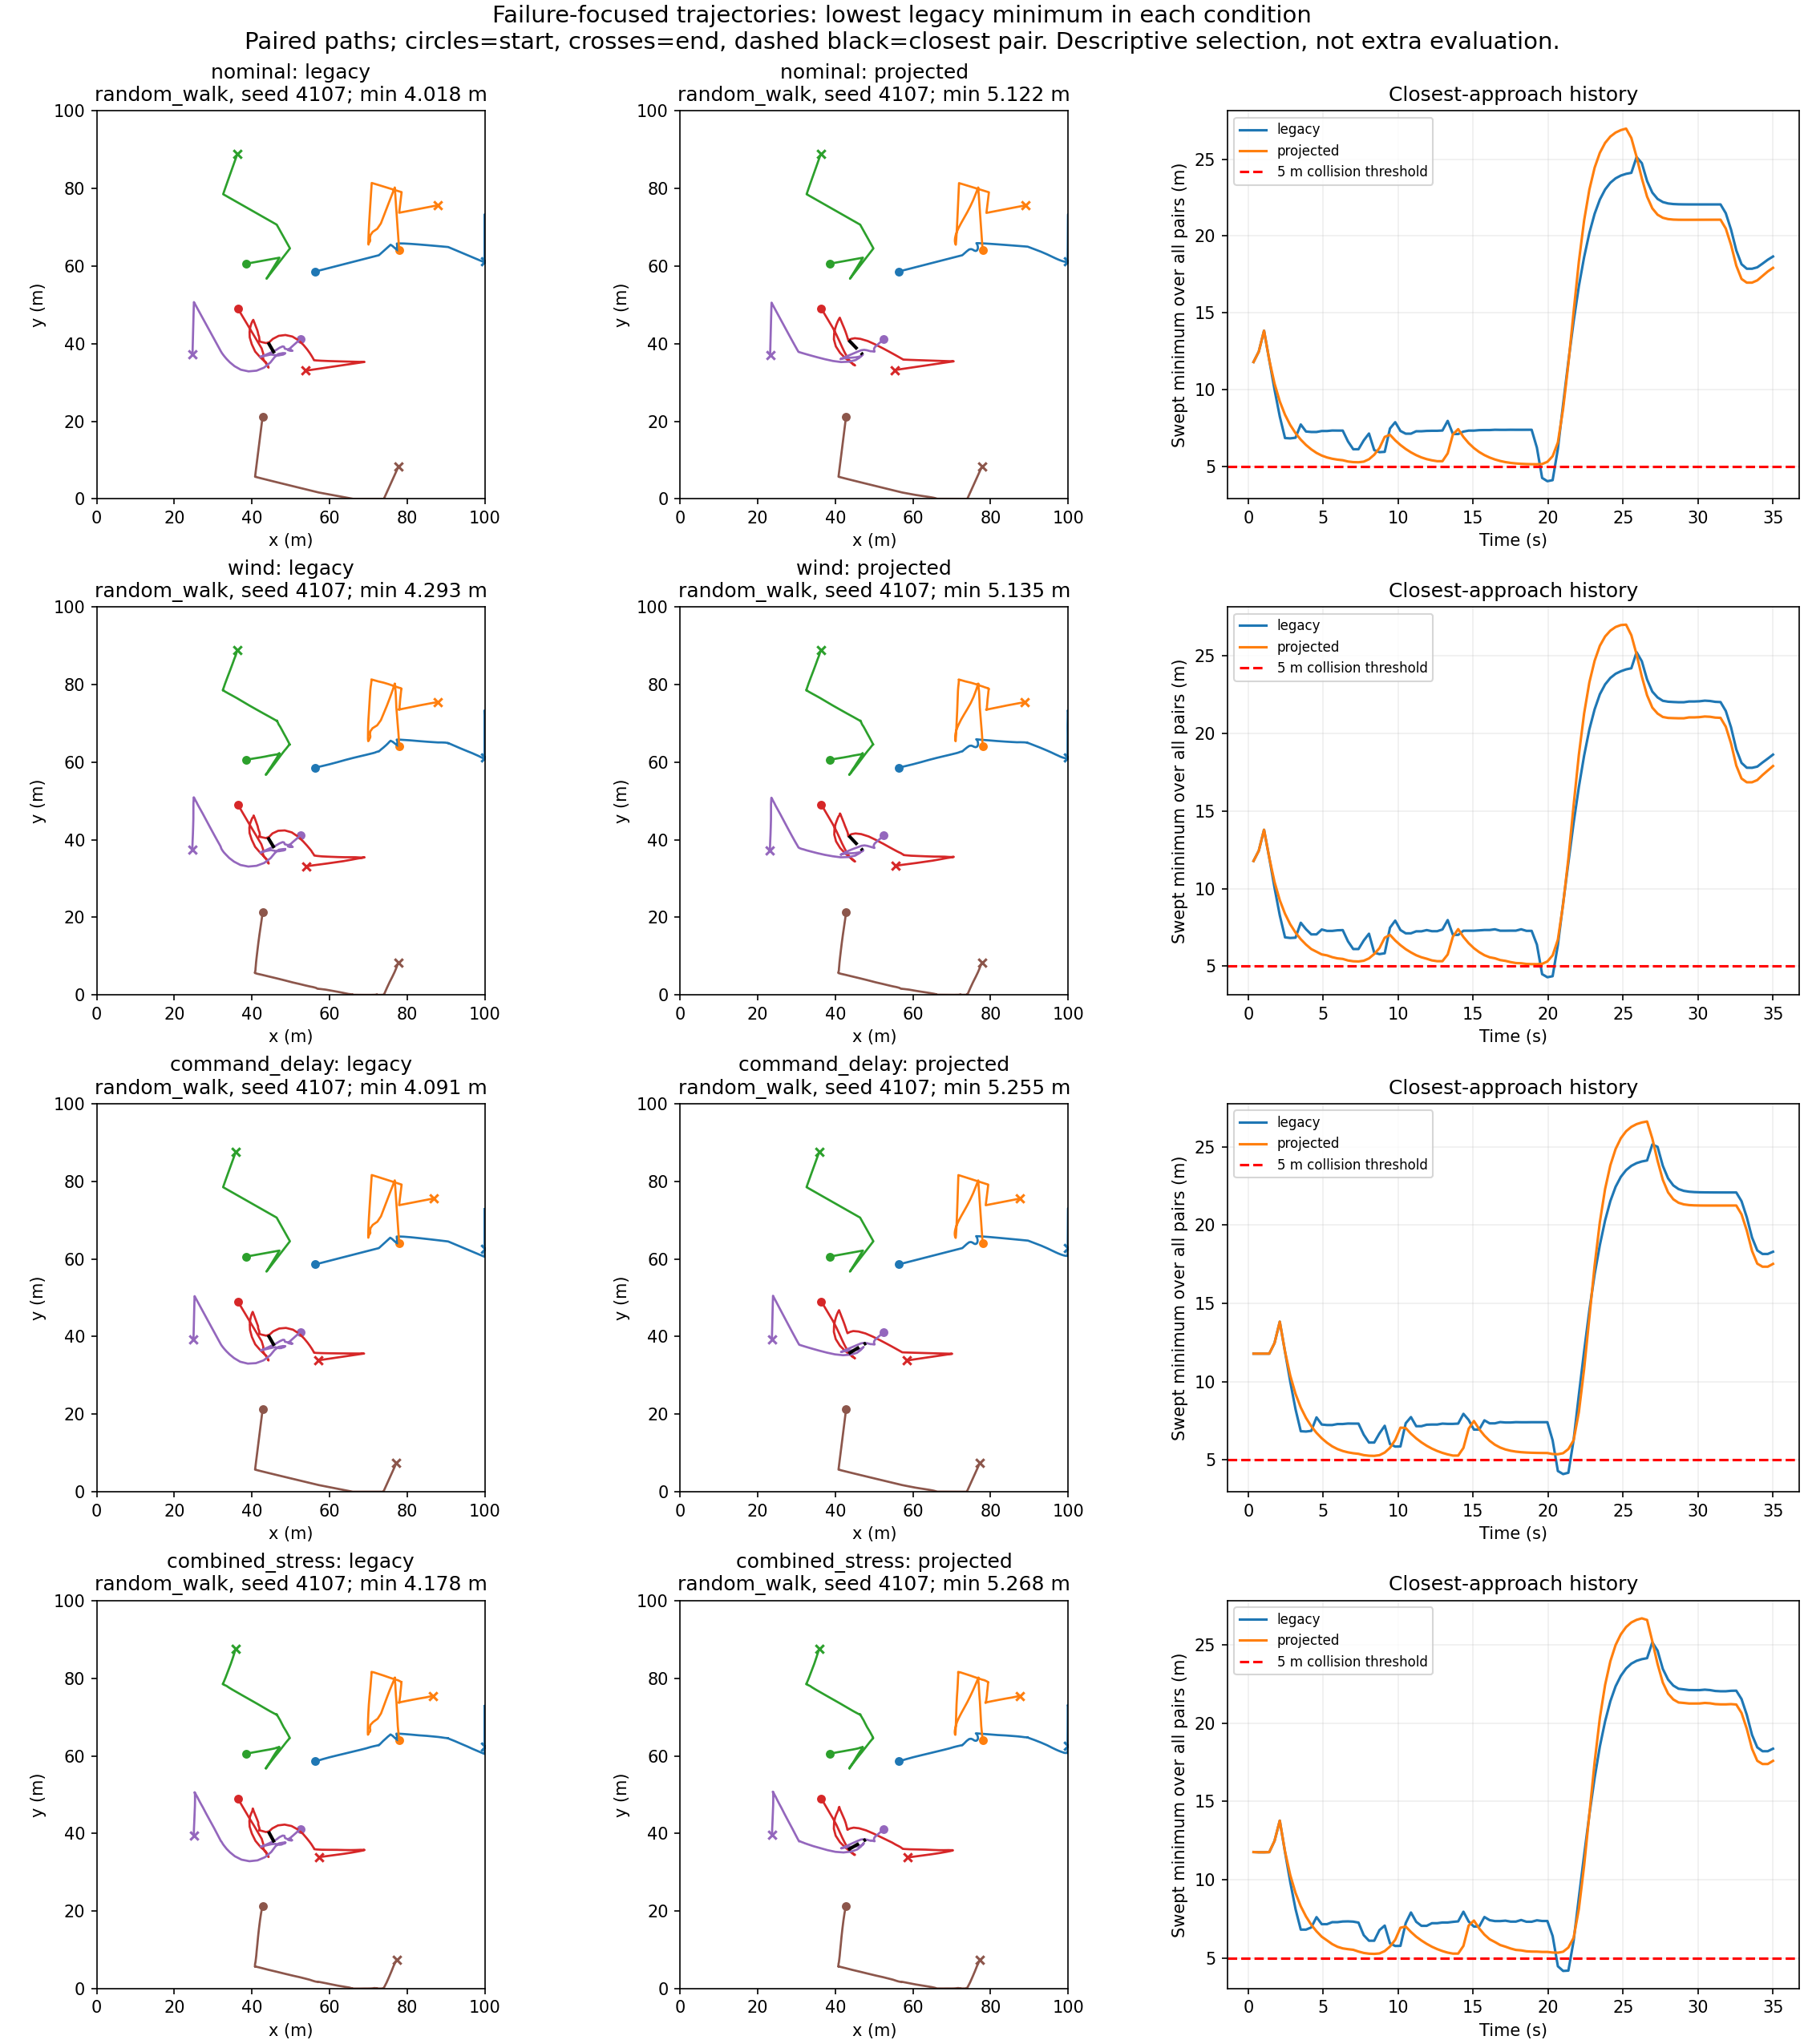
Selected low-separation trajectories
Full paired paths and separation histories expose the lowest legacy swept minimum in each condition.
Interpretation & provenance for Selected low-separation trajectories
These cases are descriptively selected by the lowest legacy minimum (ties by policy and seed), not random representative flights or additional trials. Collisions count pair-steps below 5 m, not unique crashes. Separate terrain regression seeds 2106/2107 are not part of the 448-episode study.
Original source file
reports/separation_local/main/failure_trajectories.png
SHA-256 · original and download
9e7d7b0ed1cf481e919f94b82ad14ac928b8fe2c1944d11e9ef49249807b7b93Obstacle missions
Mission completion, route geometry, and published adversarial audits.
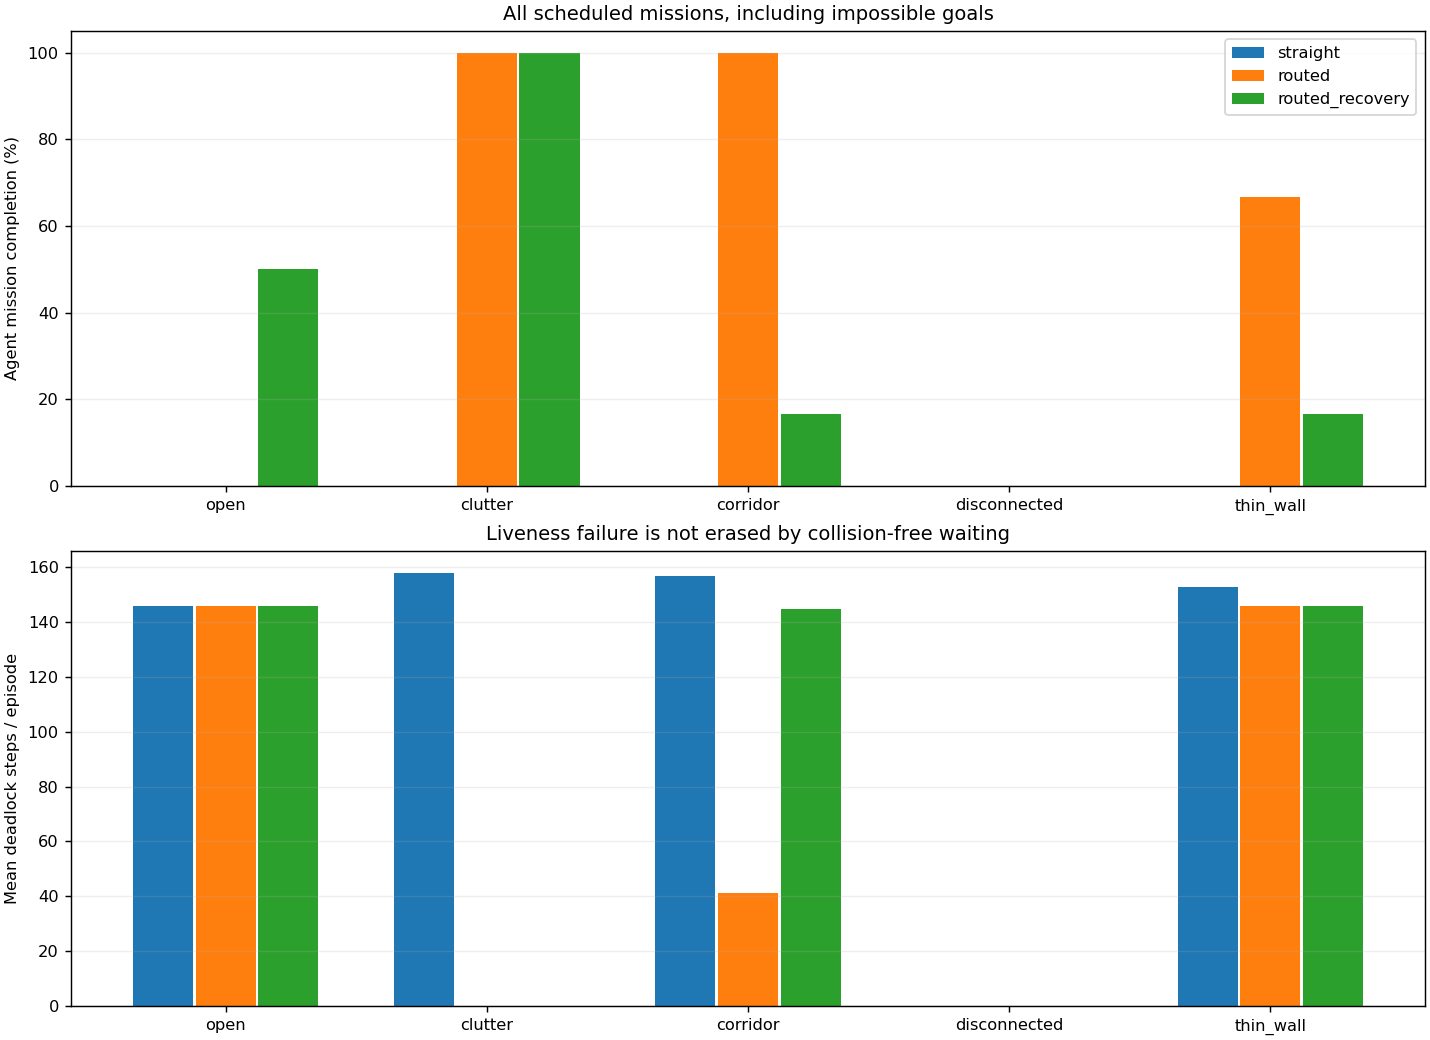
Mission outcomes across layouts
Three planners encounter open space, clutter, corridors, unreachable goals, and a thin wall.
Interpretation & provenance for Mission outcomes across layouts
All 1,440 agent missions remain in the denominator: completed, unreachable, and timed out. Zero collisions or zero motion alone is not mission success; recovery can reduce completion. Exact state and known geometry; seeds vary mapping, not motion geometry. Full and hardened runs repeat the same cases, not independent geometric trials.
Byte-identical source aliases
One image is shown for these exact-byte copies. They do not add independent experimental evidence.
reports/obstacle_missions/hardened/comparison.pngreports/obstacle_missions/full/comparison.png
SHA-256 · original and download
bcd44a8a45e13076977e532afbc74c05eb3334b5a3b143e2bf000f247eb98e71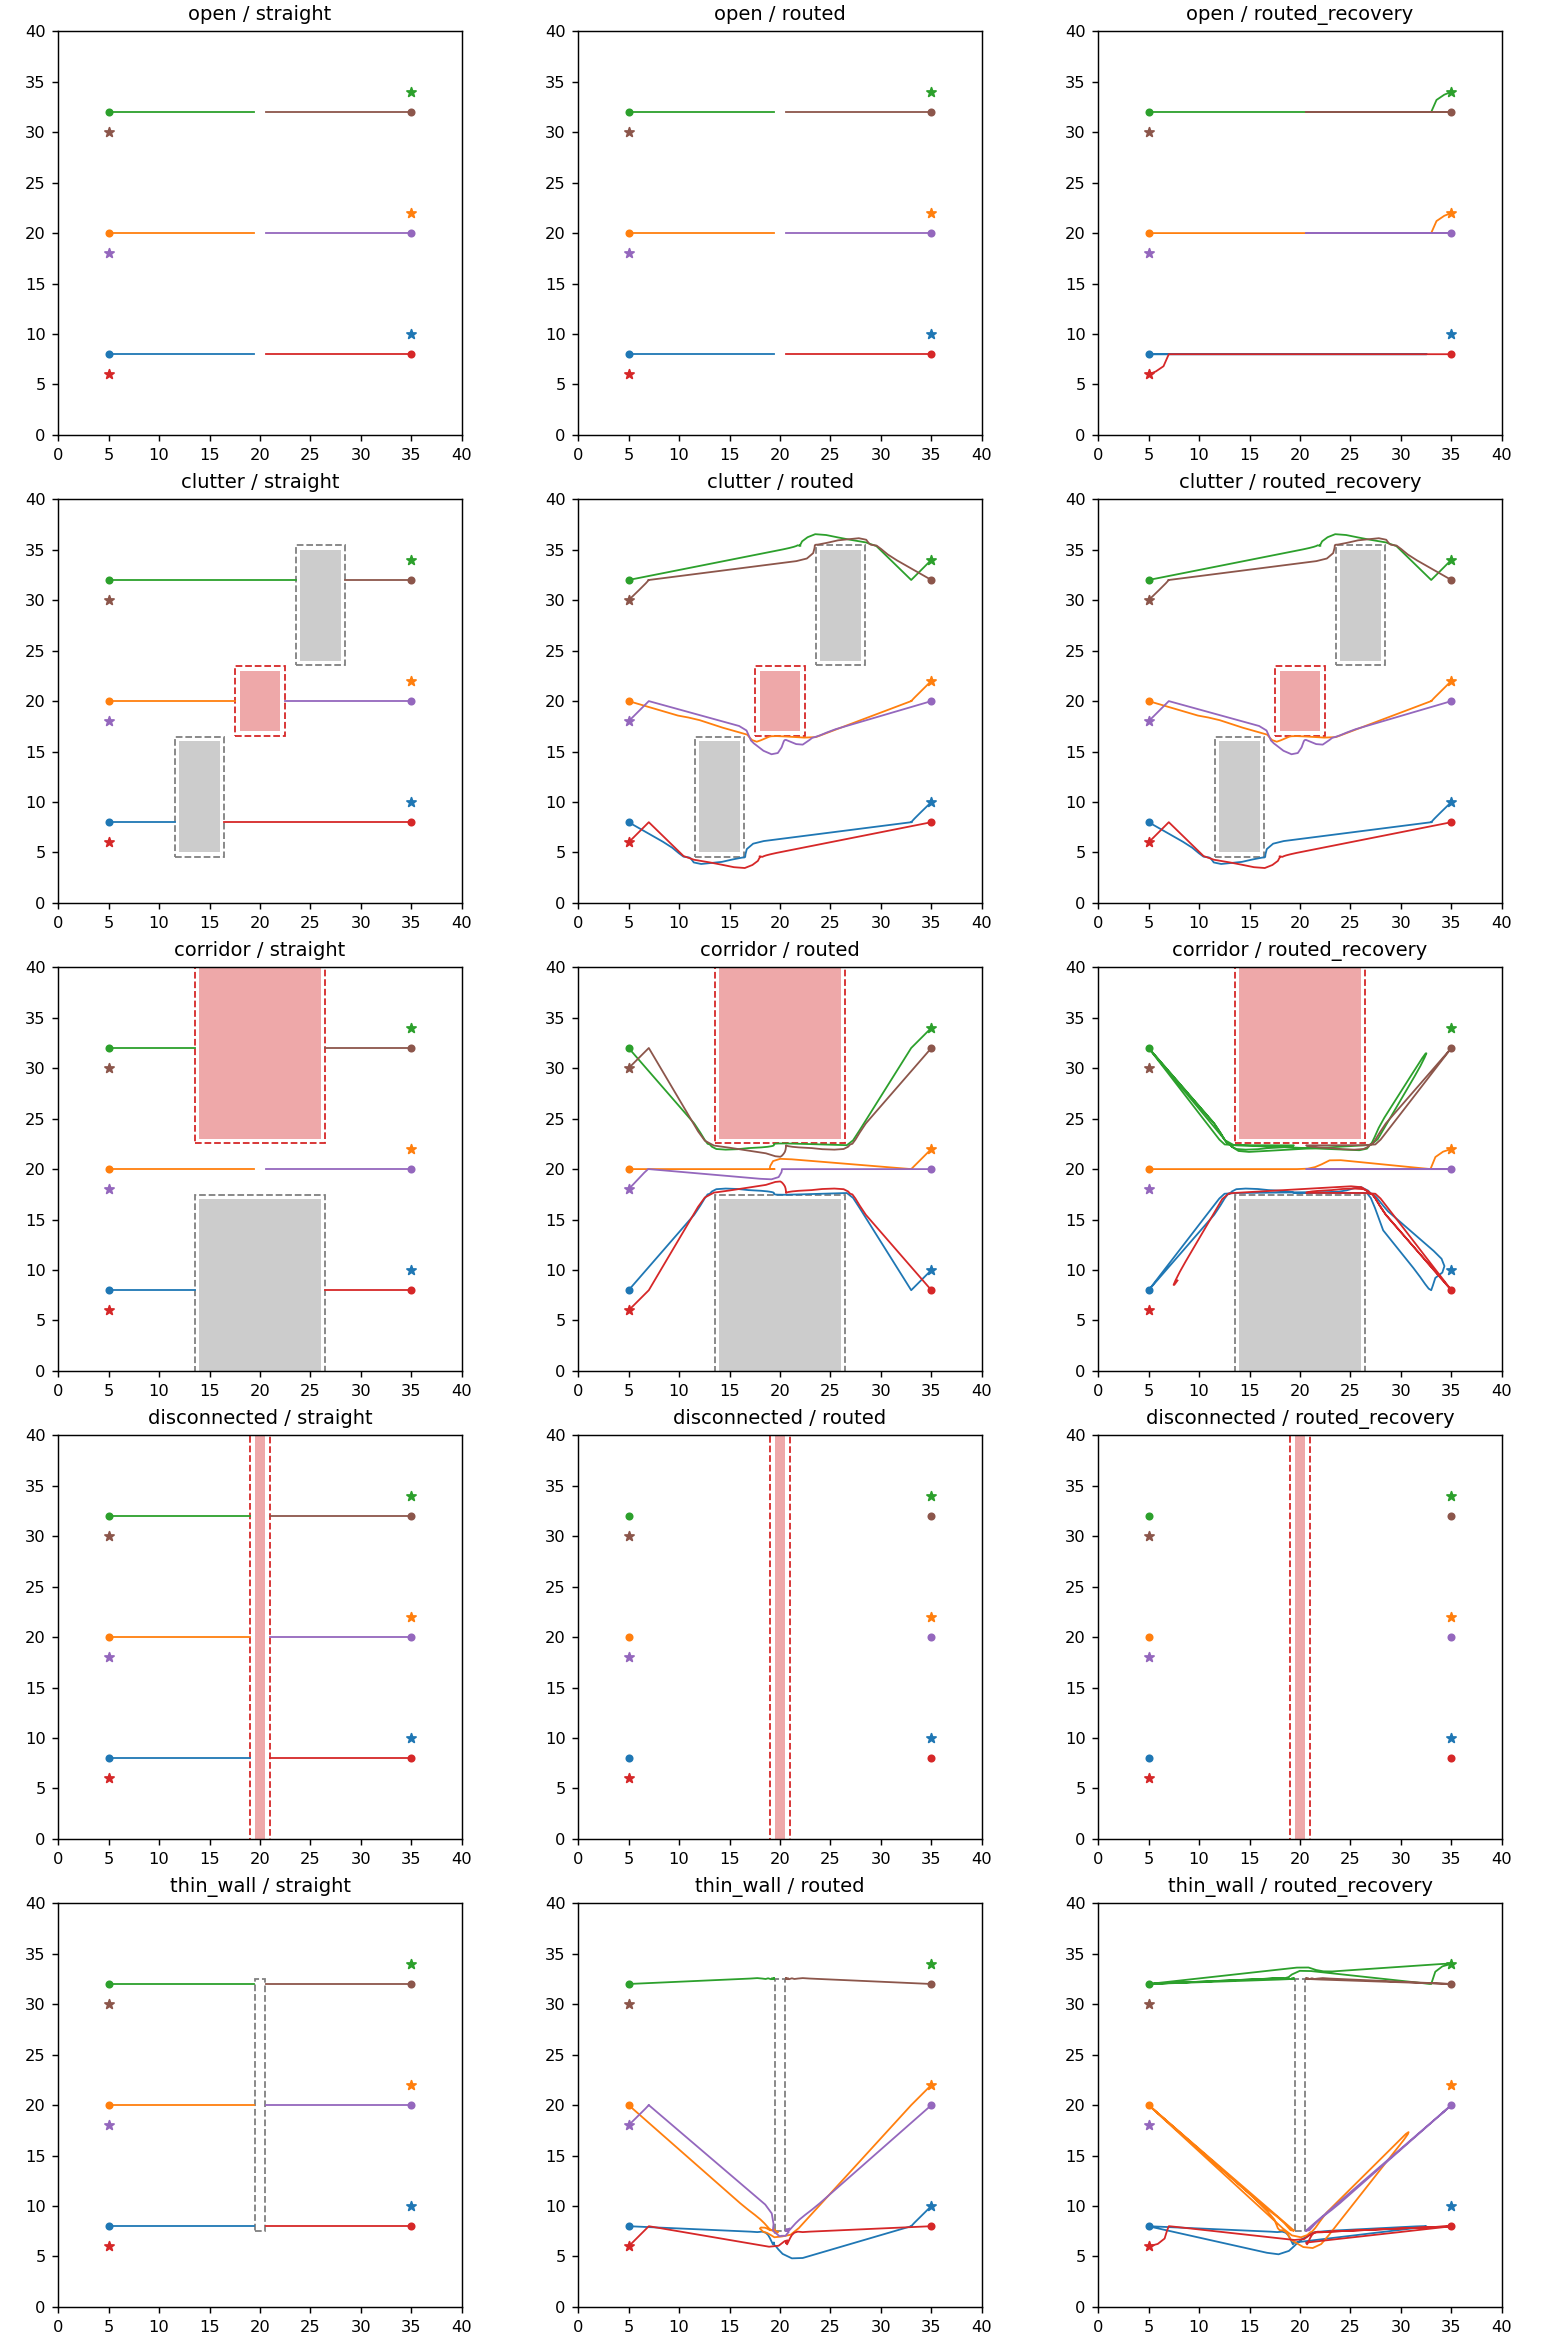
Routes, reservations, and deadlocks
Representative trajectories show how routing and priority recovery change mission paths.
Interpretation & provenance for Routes, reservations, and deadlocks
A route corner or fast goal crossing is not completion: both ordered waypoints must be reached within 0.30 m at at most 0.15 m/s. Reservations are a heuristic, not a prediction or recursive-feasibility proof. Exact state and known geometry; seeds vary mapping, not motion geometry. Full and hardened runs repeat the same cases, not independent geometric trials.
Byte-identical source aliases
One image is shown for these exact-byte copies. They do not add independent experimental evidence.
reports/obstacle_missions/hardened/trajectories.pngreports/obstacle_missions/full/trajectories.png
SHA-256 · original and download
c6cc8c29434dd58fe049ec7d66f80dcb98b10ce47eef9585915a0621dcd76997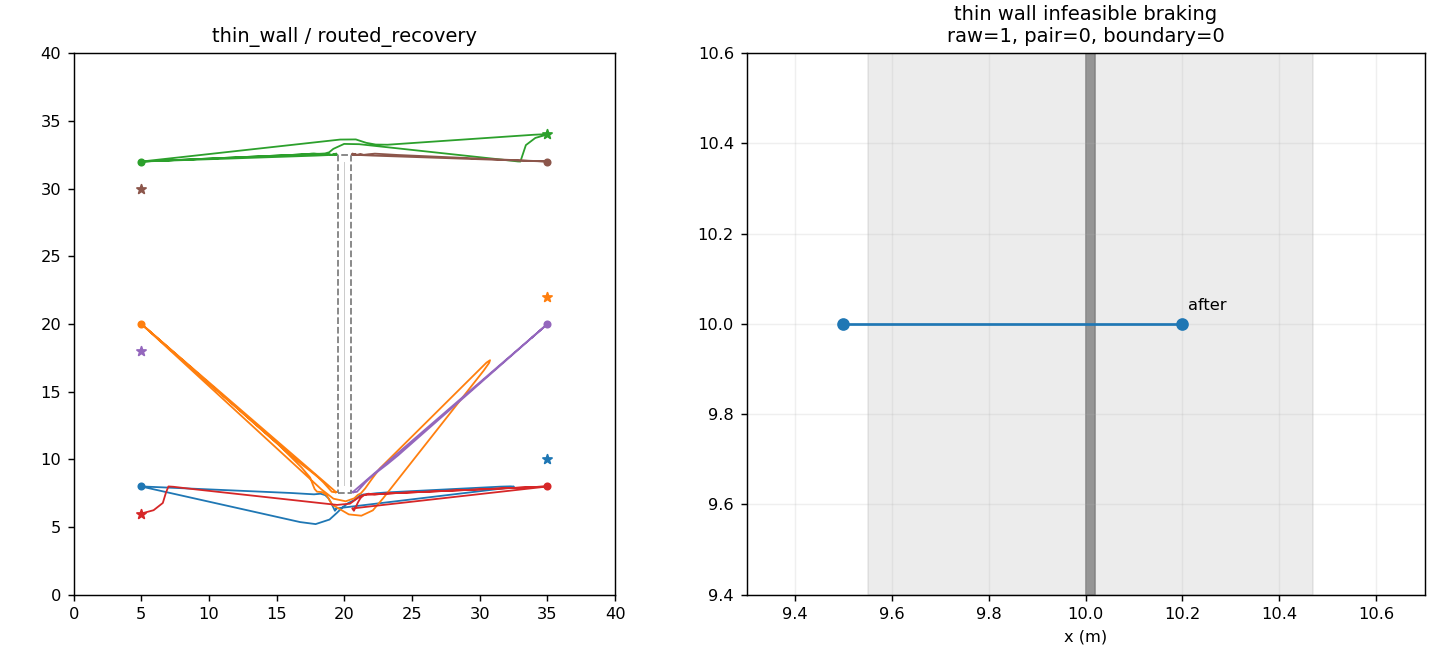
Continuous thin-wall audit
Swept-segment geometry detects a wall crossing that endpoint-only checks can miss.
Interpretation & provenance for Continuous thin-wall audit
The wall is 0.02 m thick, below map-grid spacing. This deliberately published adversarial geometry audit is retained, unlike incidental test-fixture images. It is not an extra mission episode or a claim of perception through obstacles. Exact state and known geometry; seeds vary mapping, not motion geometry. Full and hardened runs repeat the same cases, not independent geometric trials.
Byte-identical source aliases
One image is shown for these exact-byte copies. They do not add independent experimental evidence.
reports/obstacle_missions/hardened/thin_wall_audit.pngreports/obstacle_missions/full/thin_wall_audit.png
SHA-256 · original and download
cd11df2a3fbb9d109501b57ad92a195bbf6baecd74f225ae0dea68233ae42227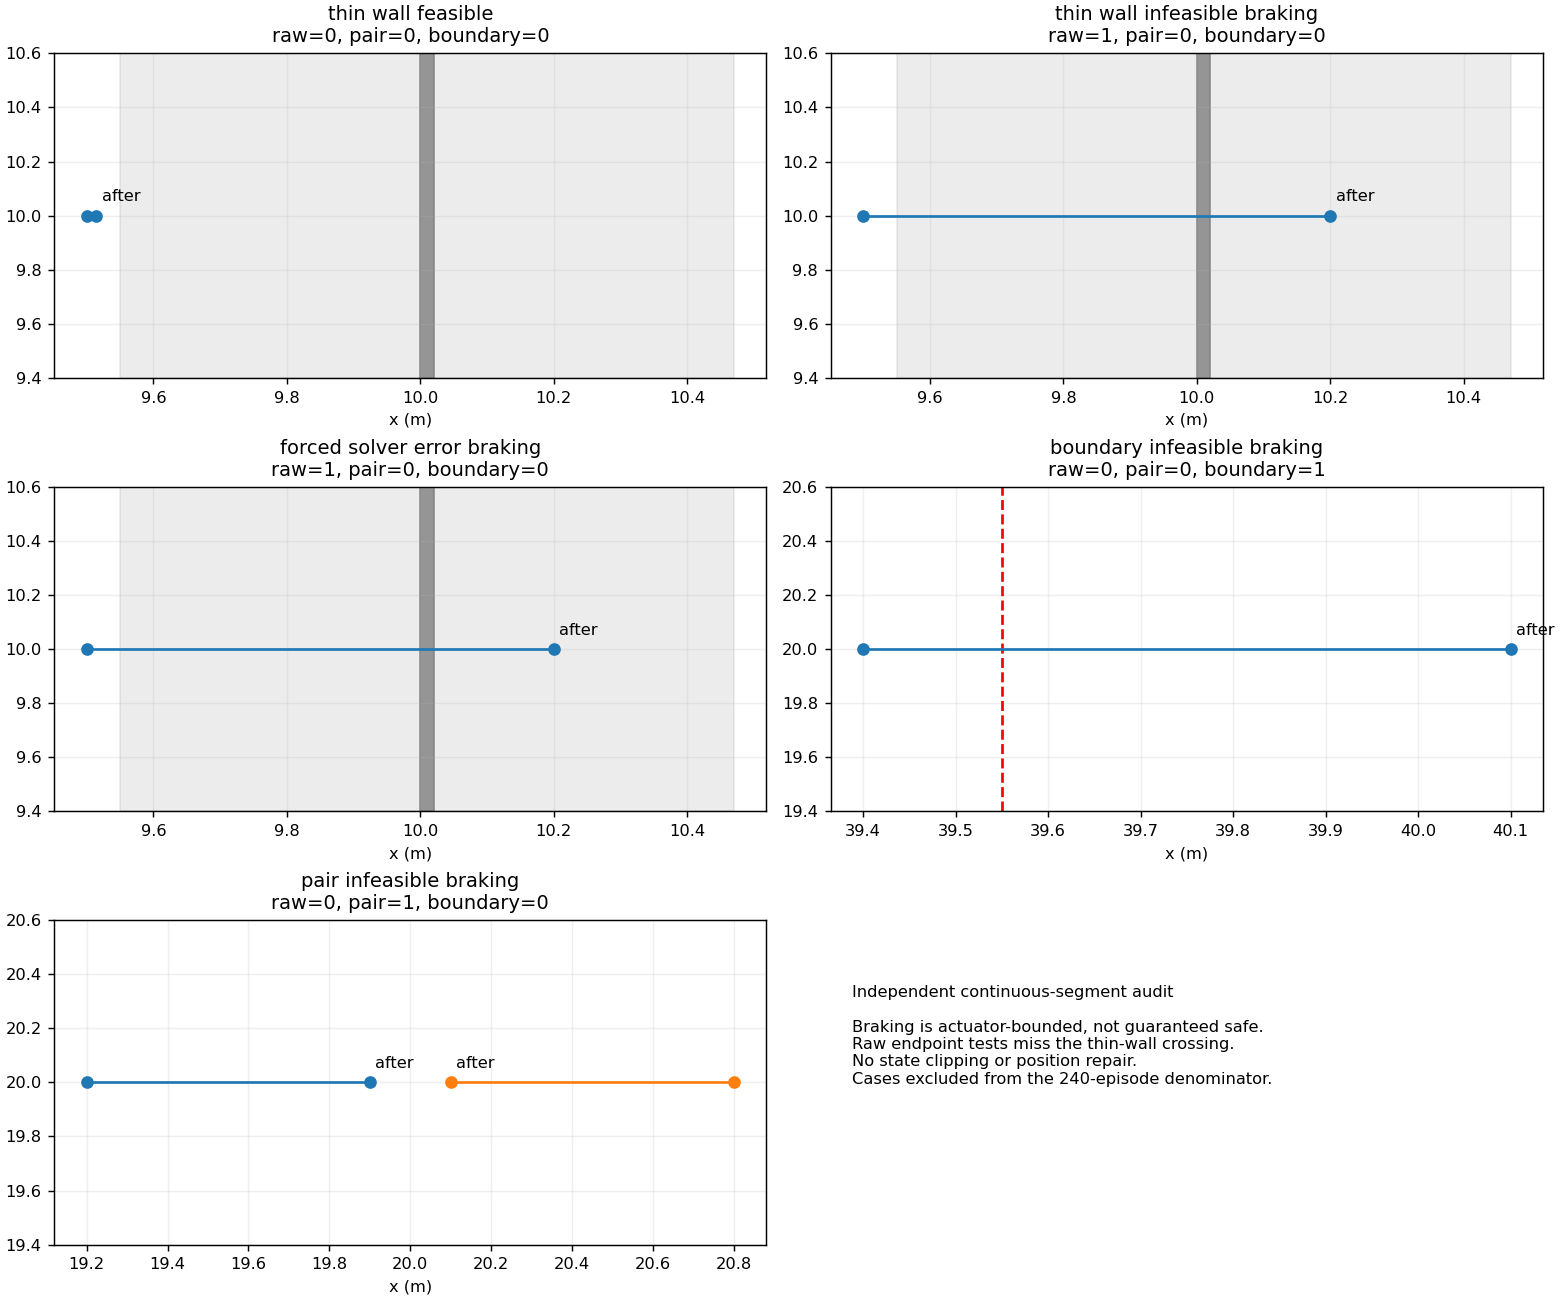
Where bounded braking fails
Published adversarial cases retain wall, boundary, and pair violations during fallback braking.
Interpretation & provenance for Where bounded braking fails
Actuator-bounded braking is not guaranteed safe. Infeasible initial conditions and forced solver failure can still produce collisions; no clipping or position repair erases them. These audit cases are separate from the 240-episode denominator. Full/hardened copies are byte-identical.
Byte-identical source aliases
One image is shown for these exact-byte copies. They do not add independent experimental evidence.
reports/obstacle_missions/hardened/braking_audit.pngreports/obstacle_missions/full/braking_audit.png
SHA-256 · original and download
beca1f81a58d7d2dcc8b19a644fe6c85274d71f531a6f884d936a824459a45ffImperfect state
What changes when navigation and commands are uncertain or delayed.
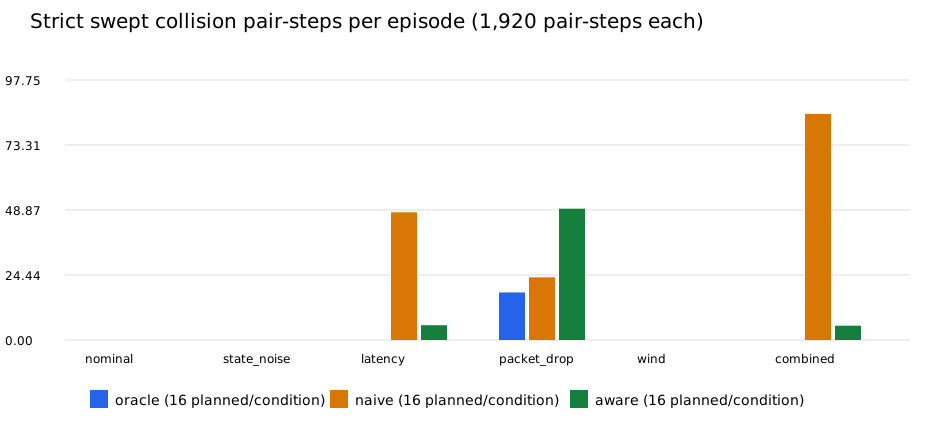
Collision exposure under imperfect state
Oracle, naive, and uncertainty-aware controllers are compared across six sensing and transport conditions.
Interpretation & provenance for Collision exposure under imperfect state
Swept pair-step collisions are repeated exposures, not unique crashes. Sixteen seeds per stratum are not a population safety estimate. The aware controller still collides; an uncertainty model and bounded braking do not establish safe stopping or flight readiness.
Original source file
reports/imperfect_state/figures/collisions.svg
SHA-256 · original and download
b3779d596d3ef44e52d6c826c773b0dc4caa4128f0bf988b8e6af24338c6c335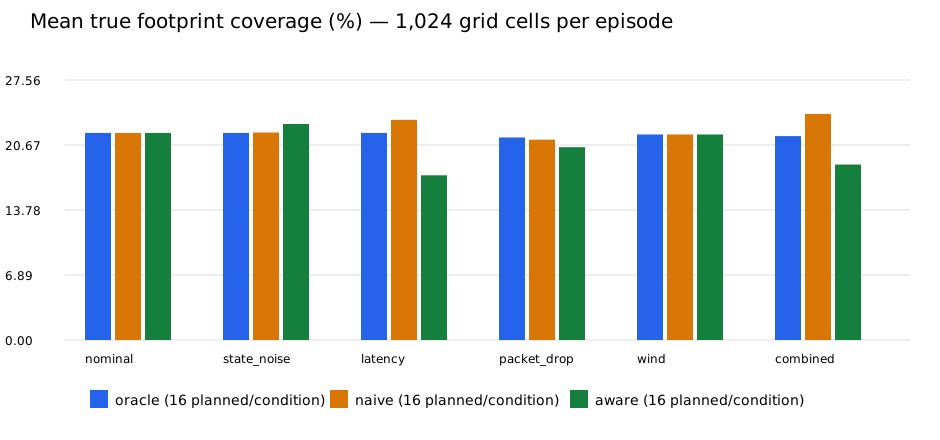
True footprint coverage
Coverage records the fraction of 1,024 grid cells visited in each simulated episode.
Interpretation & provenance for True footprint coverage
This is evaluator true footprint coverage, not communicated evidence, calibrated mapping confidence, or a planner input. Safety and progress must be considered together; conservative stationary behavior can look safe while surveying little.
Original source file
reports/imperfect_state/figures/coverage.svg
SHA-256 · original and download
3ca591d82b251a41f9c1f796fa4ee7dd3e5275b142829f77c2b315fb771878e2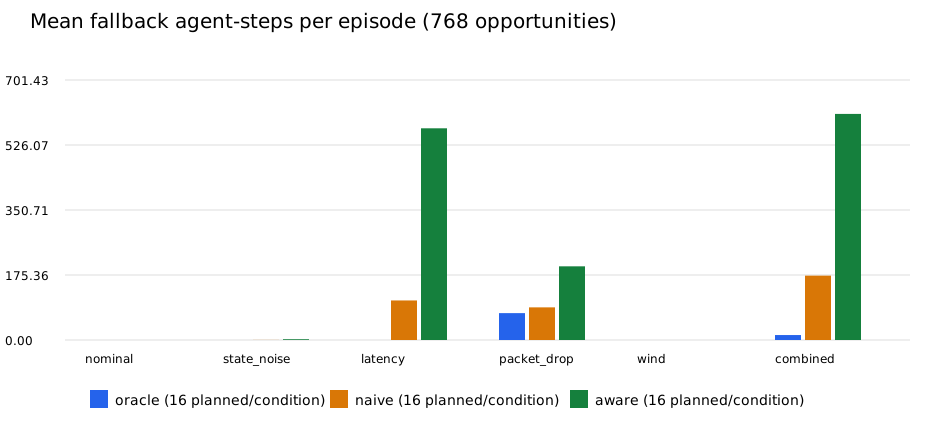
Fallback demand
Mean fallback agent-steps reveal how often the controller cannot accept a nominal command.
Interpretation & provenance for Fallback demand
Each episode has 768 agent-step opportunities (six agents × 128 steps), not 768 independent trials. Missing or stale state can trigger uncertified braking, and dropped commands can change what executes. Fallback counts are neither collision counts nor safety certificates.
Original source file
reports/imperfect_state/figures/fallback.svg
SHA-256 · original and download
8ed3256aa0deaed8a00926213eae886c448919f6506fc22b681c1e4908508be4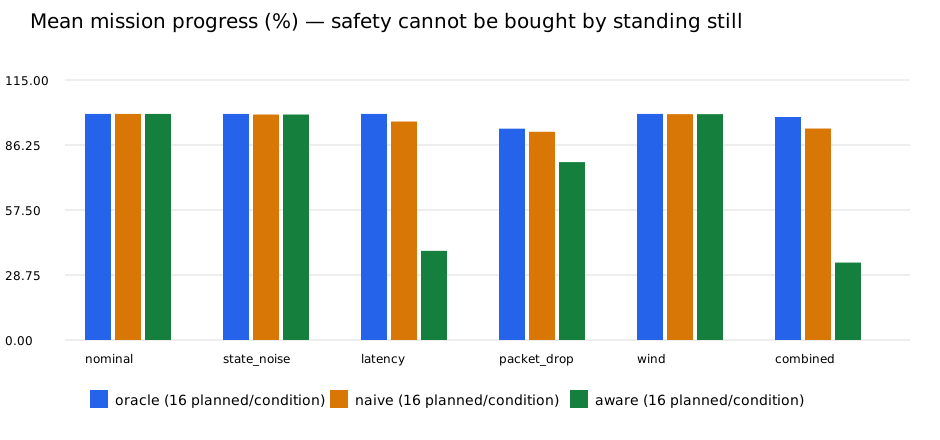
Mission progress with delayed information
Goal-distance progress tests whether reduced collision exposure comes at the cost of stalled missions.
Interpretation & provenance for Mission progress with delayed information
Progress is mean 1 − final distance / initial distance, without clipping, not the fraction of agents completing a mission. Latency and combined conditions can stall the aware controller. The independent Euler point-agent model does not validate the older field planner.
Original source file
reports/imperfect_state/figures/mission_progress.svg
SHA-256 · original and download
4ed86a907e31e3286cbbfaa68391d8054f7683626b99a6e6bde541bcb1c99cd8Adaptation & generalization
New terrain splits and a frozen candidate against systematic baselines.
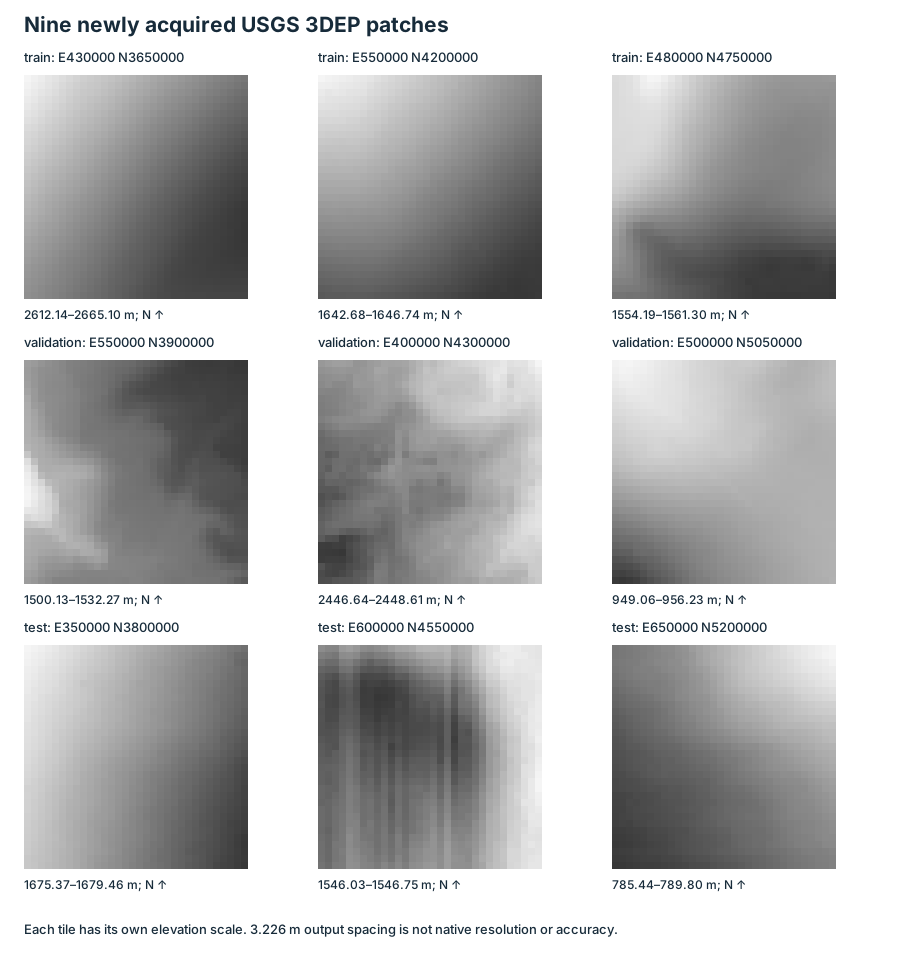
Nine new terrain patches
Coordinate-defined USGS patches form disjoint train, validation, and test location splits.
Interpretation & provenance for Nine new terrain patches
North-up elevation is normalized independently per patch. The 100 m span and 32-pixel output do not establish native resolution or sensor accuracy. Convenience coordinates are not sampled ecology classes; three test geographies cannot demonstrate nationwide transfer.
Original source file
reports/adaptation_generalization/figures/terrain.svg
SHA-256 · original and download
a062b120e53db02241978c63325fde1f2c7a49e818e73a27eab038e274dc0540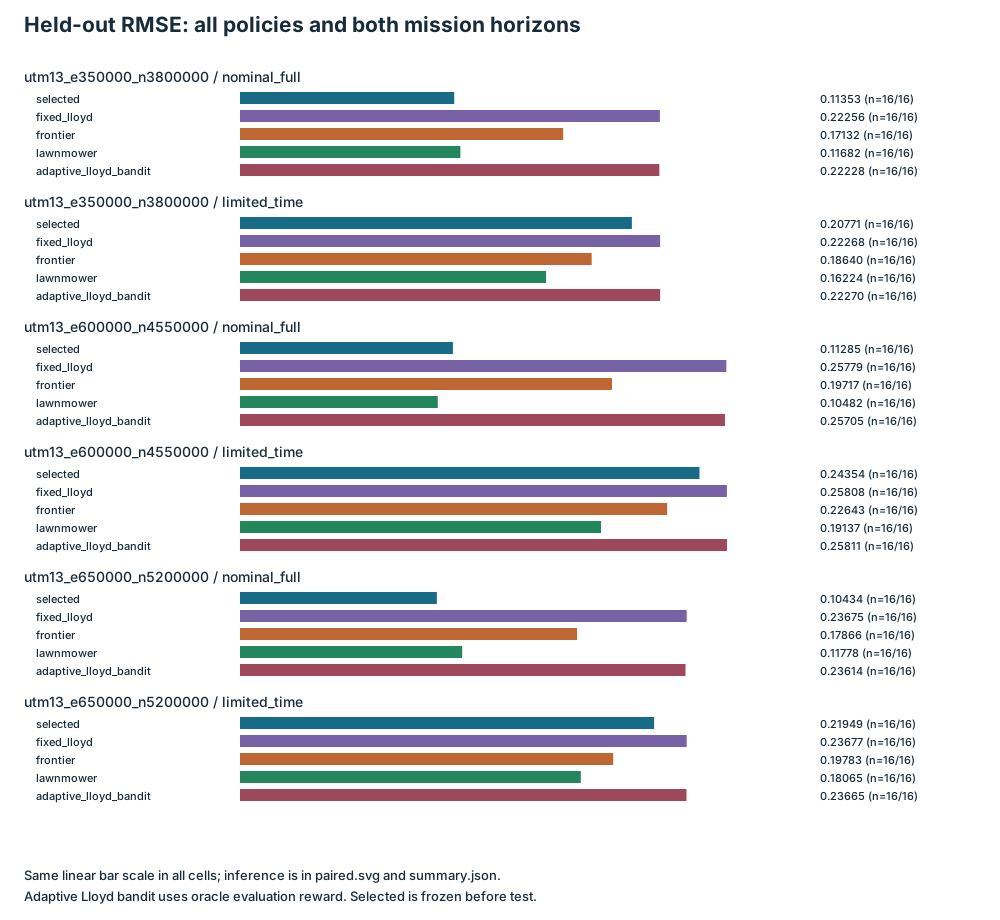
Held-out reconstruction by horizon
All five policies are compared on each test location at full and limited mission horizons.
Interpretation & provenance for Held-out reconstruction by horizon
Bars are within-location means across sixteen seeds; lower normalized RMSE is better. They are not pooled geographic estimates or real drone accuracy. The selected candidate has worse mean error than lawnmower at all three limited-time locations. Missing outcomes are never zero.
Original source file
reports/adaptation_generalization/figures/rmse.svg
SHA-256 · original and download
09b45f589bbd521168b4e25d7c20fb44e437ce05a8677630b9292887a0c120b5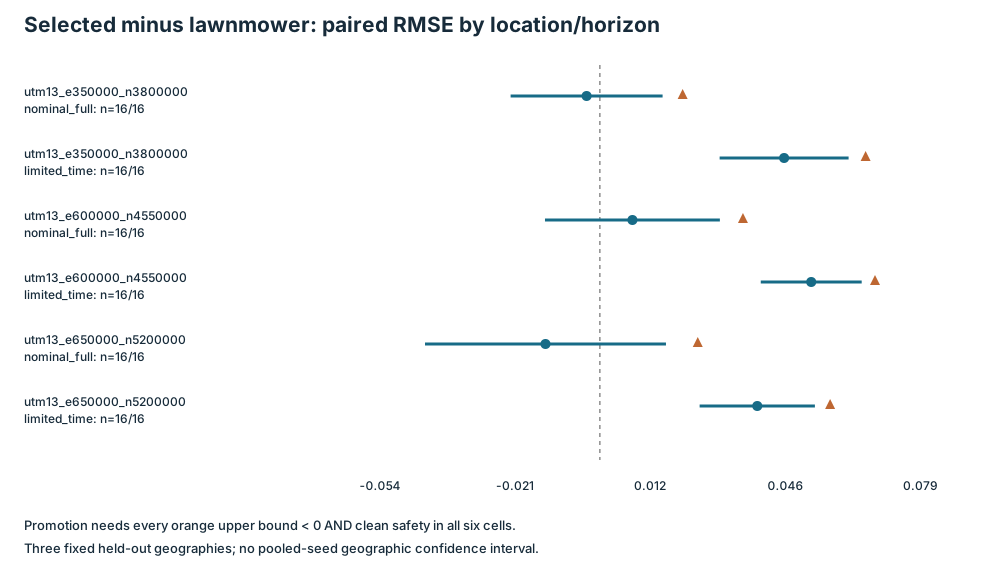
Selected policy versus lawnmower
Paired RMSE differences show why the frozen candidate was not promoted in any of six test cells.
Interpretation & provenance for Selected policy versus lawnmower
Negative favors selected. Segments are descriptive two-sided t95 intervals; triangles are six-cell Bonferroni one-sided upper bounds used for promotion. No promotion bound is below zero. Seed intervals are conditional on each fixed location, not geographic confidence bounds.
Original source file
reports/adaptation_generalization/figures/paired.svg
SHA-256 · original and download
9ccbde979f641c638083fa7b44a114792262adb3fa46d56264e6619913b4380aHistorical autonomy
Original concept diagrams and shared-map toy-model results.
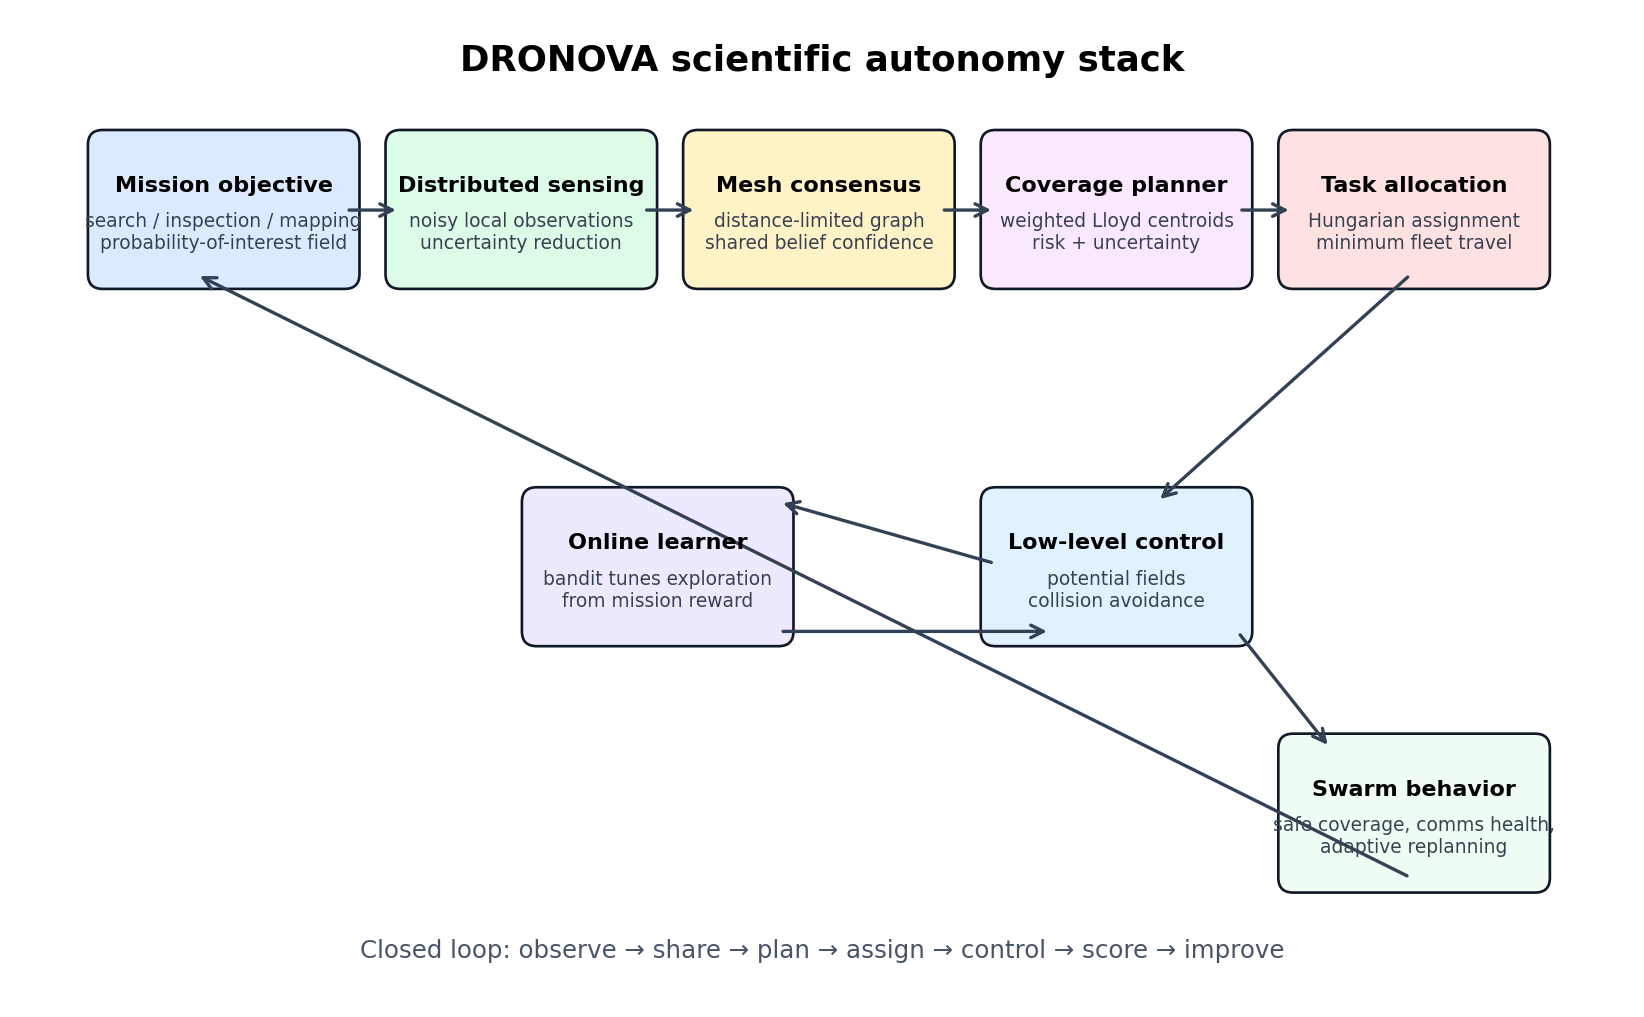
Archived autonomy loop
A concept diagram connects observation, sharing, planning, assignment, control, and a small bandit.
Interpretation & provenance for Archived autonomy loop
Architecture illustration, not a measured result or current execution trace. Historical mesh consensus lowered uncertainty without new evidence; safe coverage and improvement were aspirations. The diagram does not implement ROS, PX4, SLAM, deep RL, or a validated deployment interface.
Original source file
assets/figures/autonomy/autonomy_algorithm_stack.png
SHA-256 · original and download
340808e422f153dce1ab4c0acc5d347dbb8734c4b82dcb690f07853c4954cfcd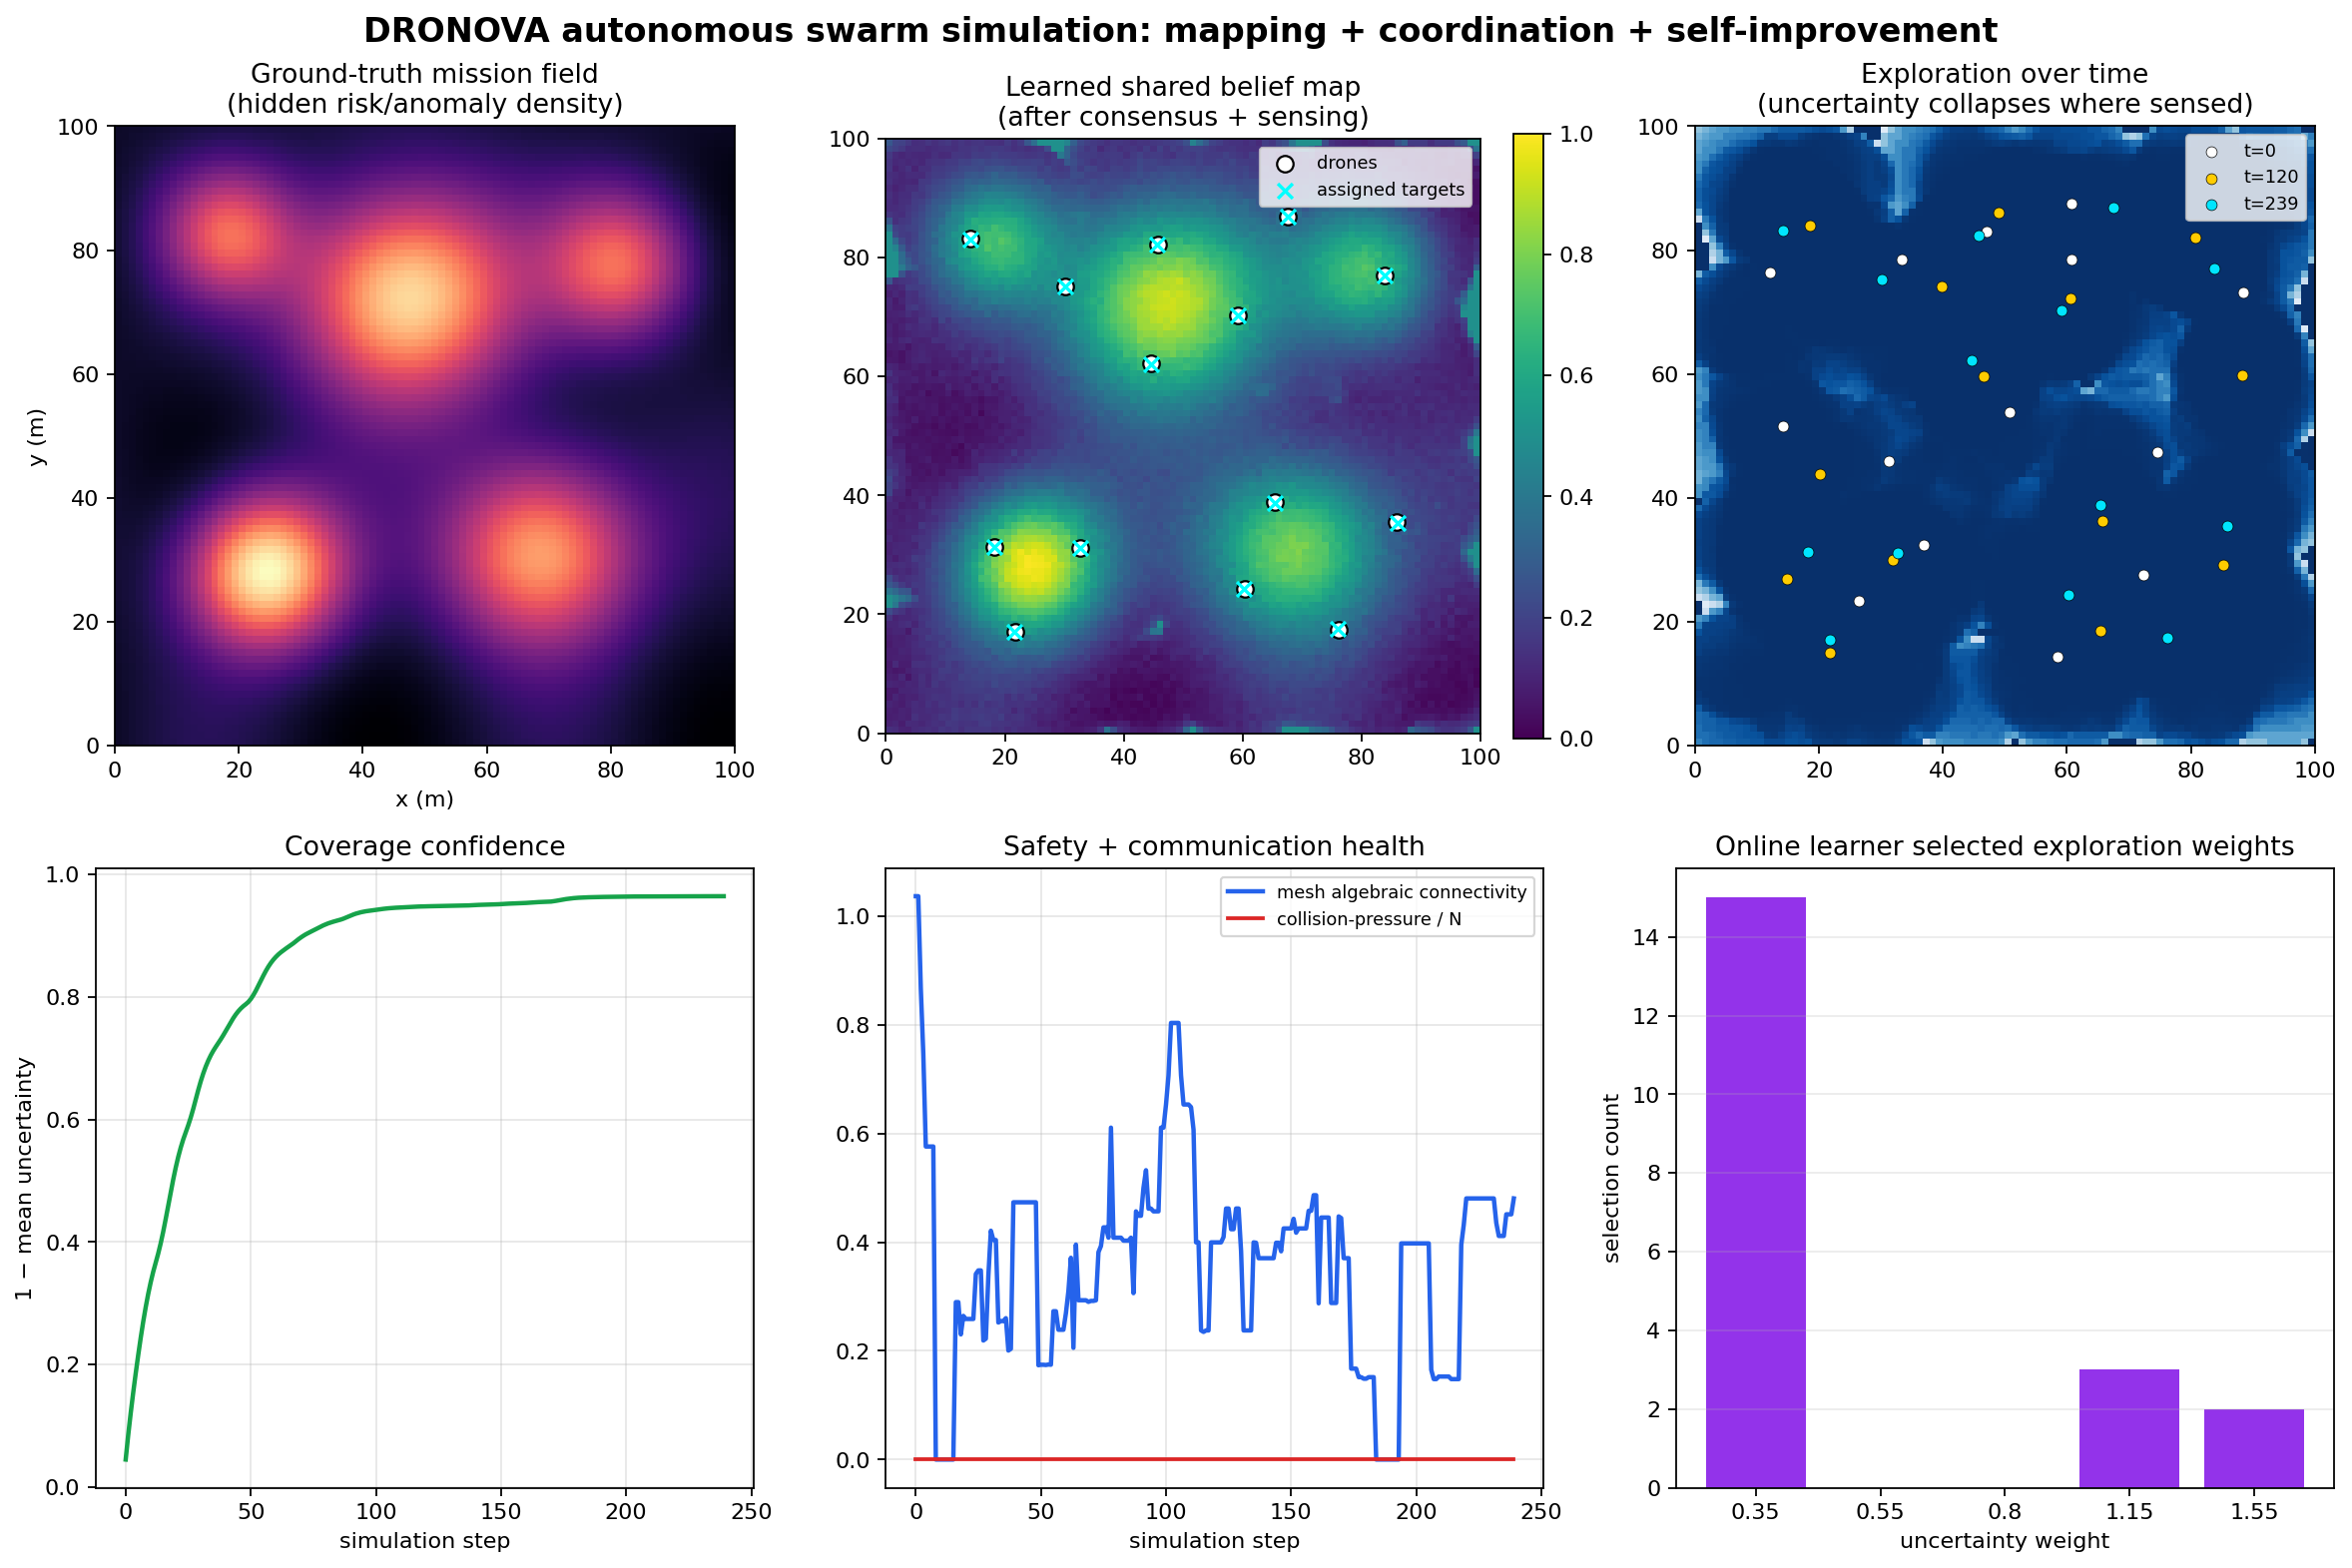
Archived shared-map dashboard
Six panels record a synthetic mission field, shared belief, uncertainty, graph diagnostics, and bandit choices.
Interpretation & provenance for Archived shared-map dashboard
The historical graph update invented confidence without sensing. The 0.964 confidence score is obsolete, not 96.4% observed area or calibrated probability; zero legacy collision pressure is not safety evidence. All drones wrote one shared map, so its no-consensus ablation did not isolate information.
Original source file
assets/figures/autonomy/autonomy_swarm_simulation.png
SHA-256 · original and download
3a4b72977aa268124a0ebdd472f7b169cd9719ce32cbecca30b5dac31f5e3ffd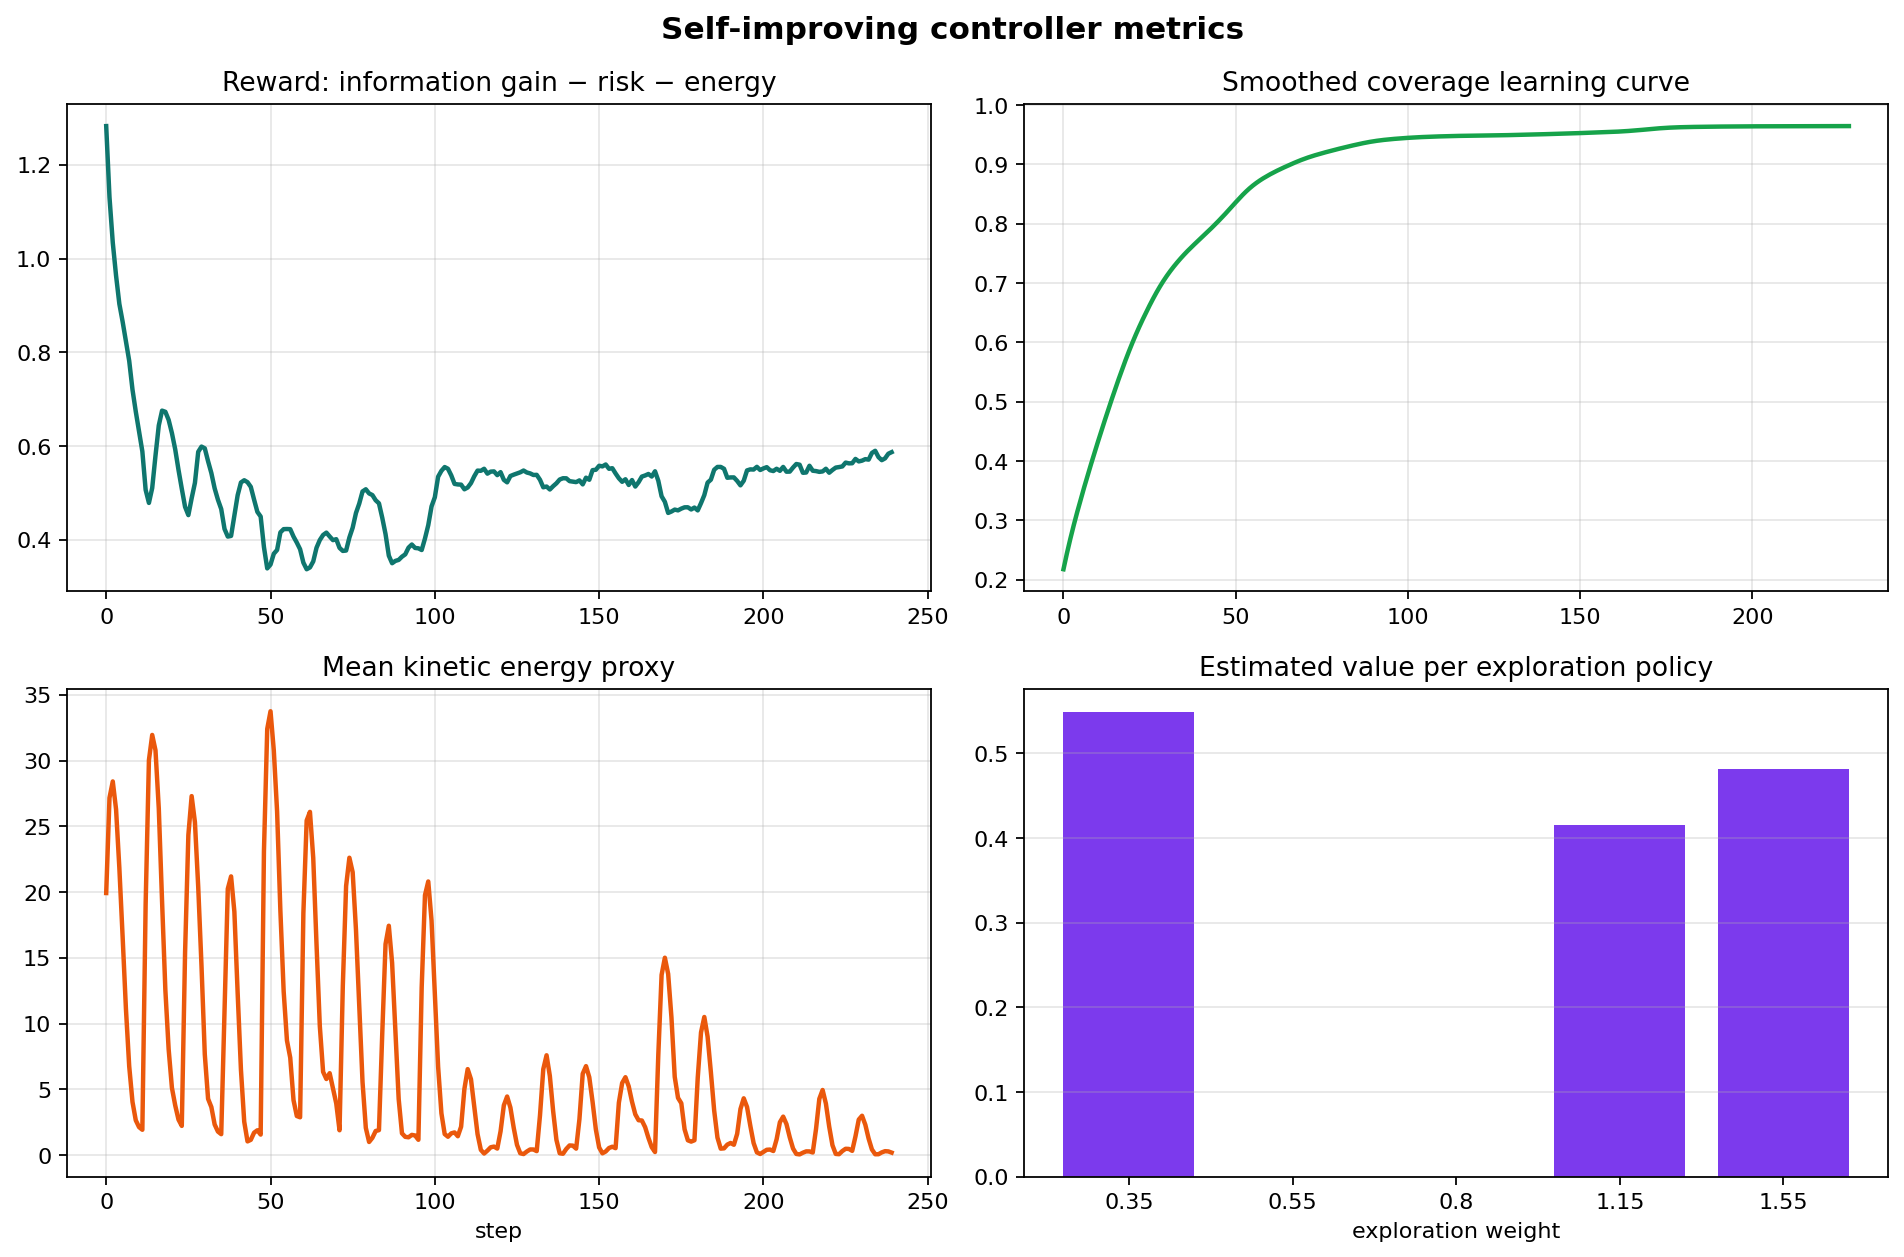
Archived online parameter choices
Legacy reward, confidence, motion cost, and option values describe one changing episode.
Interpretation & provenance for Archived online parameter choices
The confidence curve includes the flawed graph-based boost. Reward is not the rewritten-core objective; mean squared speed is not joules. No controlled multi-seed comparison or held-out learning gain is established by estimated bandit values.
Original source file
assets/figures/autonomy/autonomy_learning_metrics.png
SHA-256 · original and download
767794fdda902502b37595b62c80cee5f934709e9f5e8088592a49aa24a945c6Historical learning
Archived correction-loop concepts with privileged simulated information.
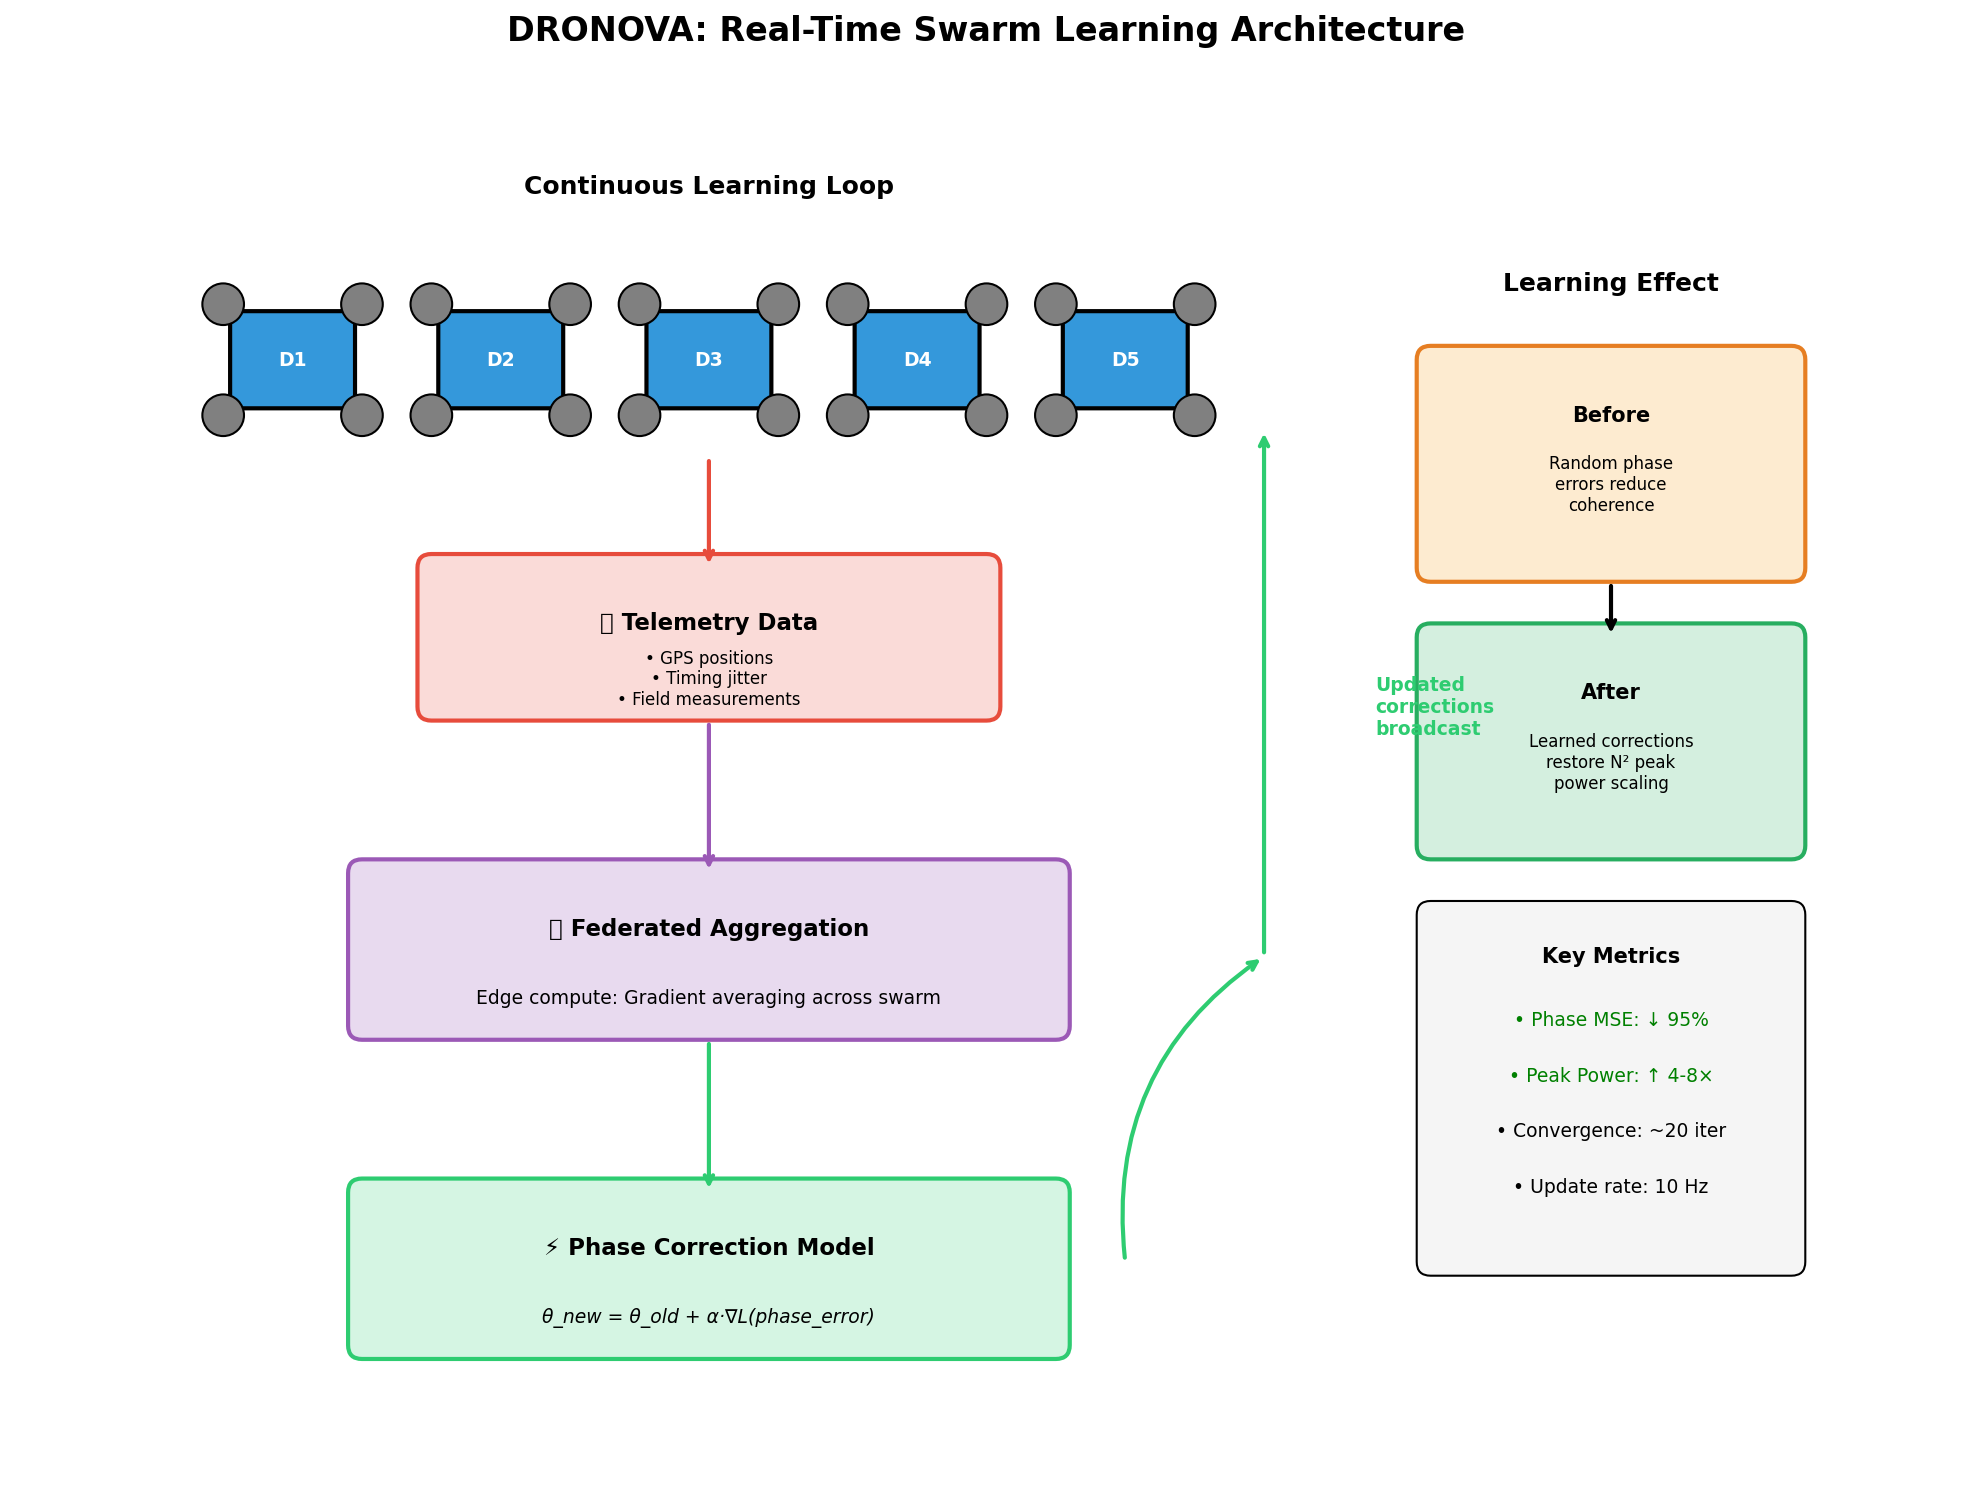
Archived learning concept
Drawn telemetry and aggregation arrows illustrate a proposed correction loop.
Interpretation & provenance for Archived learning concept
The 95% MSE reduction, 4–8× power, approximately 20 iterations, and 10 Hz labels are hardcoded drawing text, not measurements. No federated training, real telemetry, or demonstrated EM improvement is implemented by this diagram.
Original source file
assets/figures/learning/live_learning_architecture.png
SHA-256 · original and download
5536963d8d7f889b592ed6bc9b32609c79fd6266f56c4ecfae39125a6afb9f73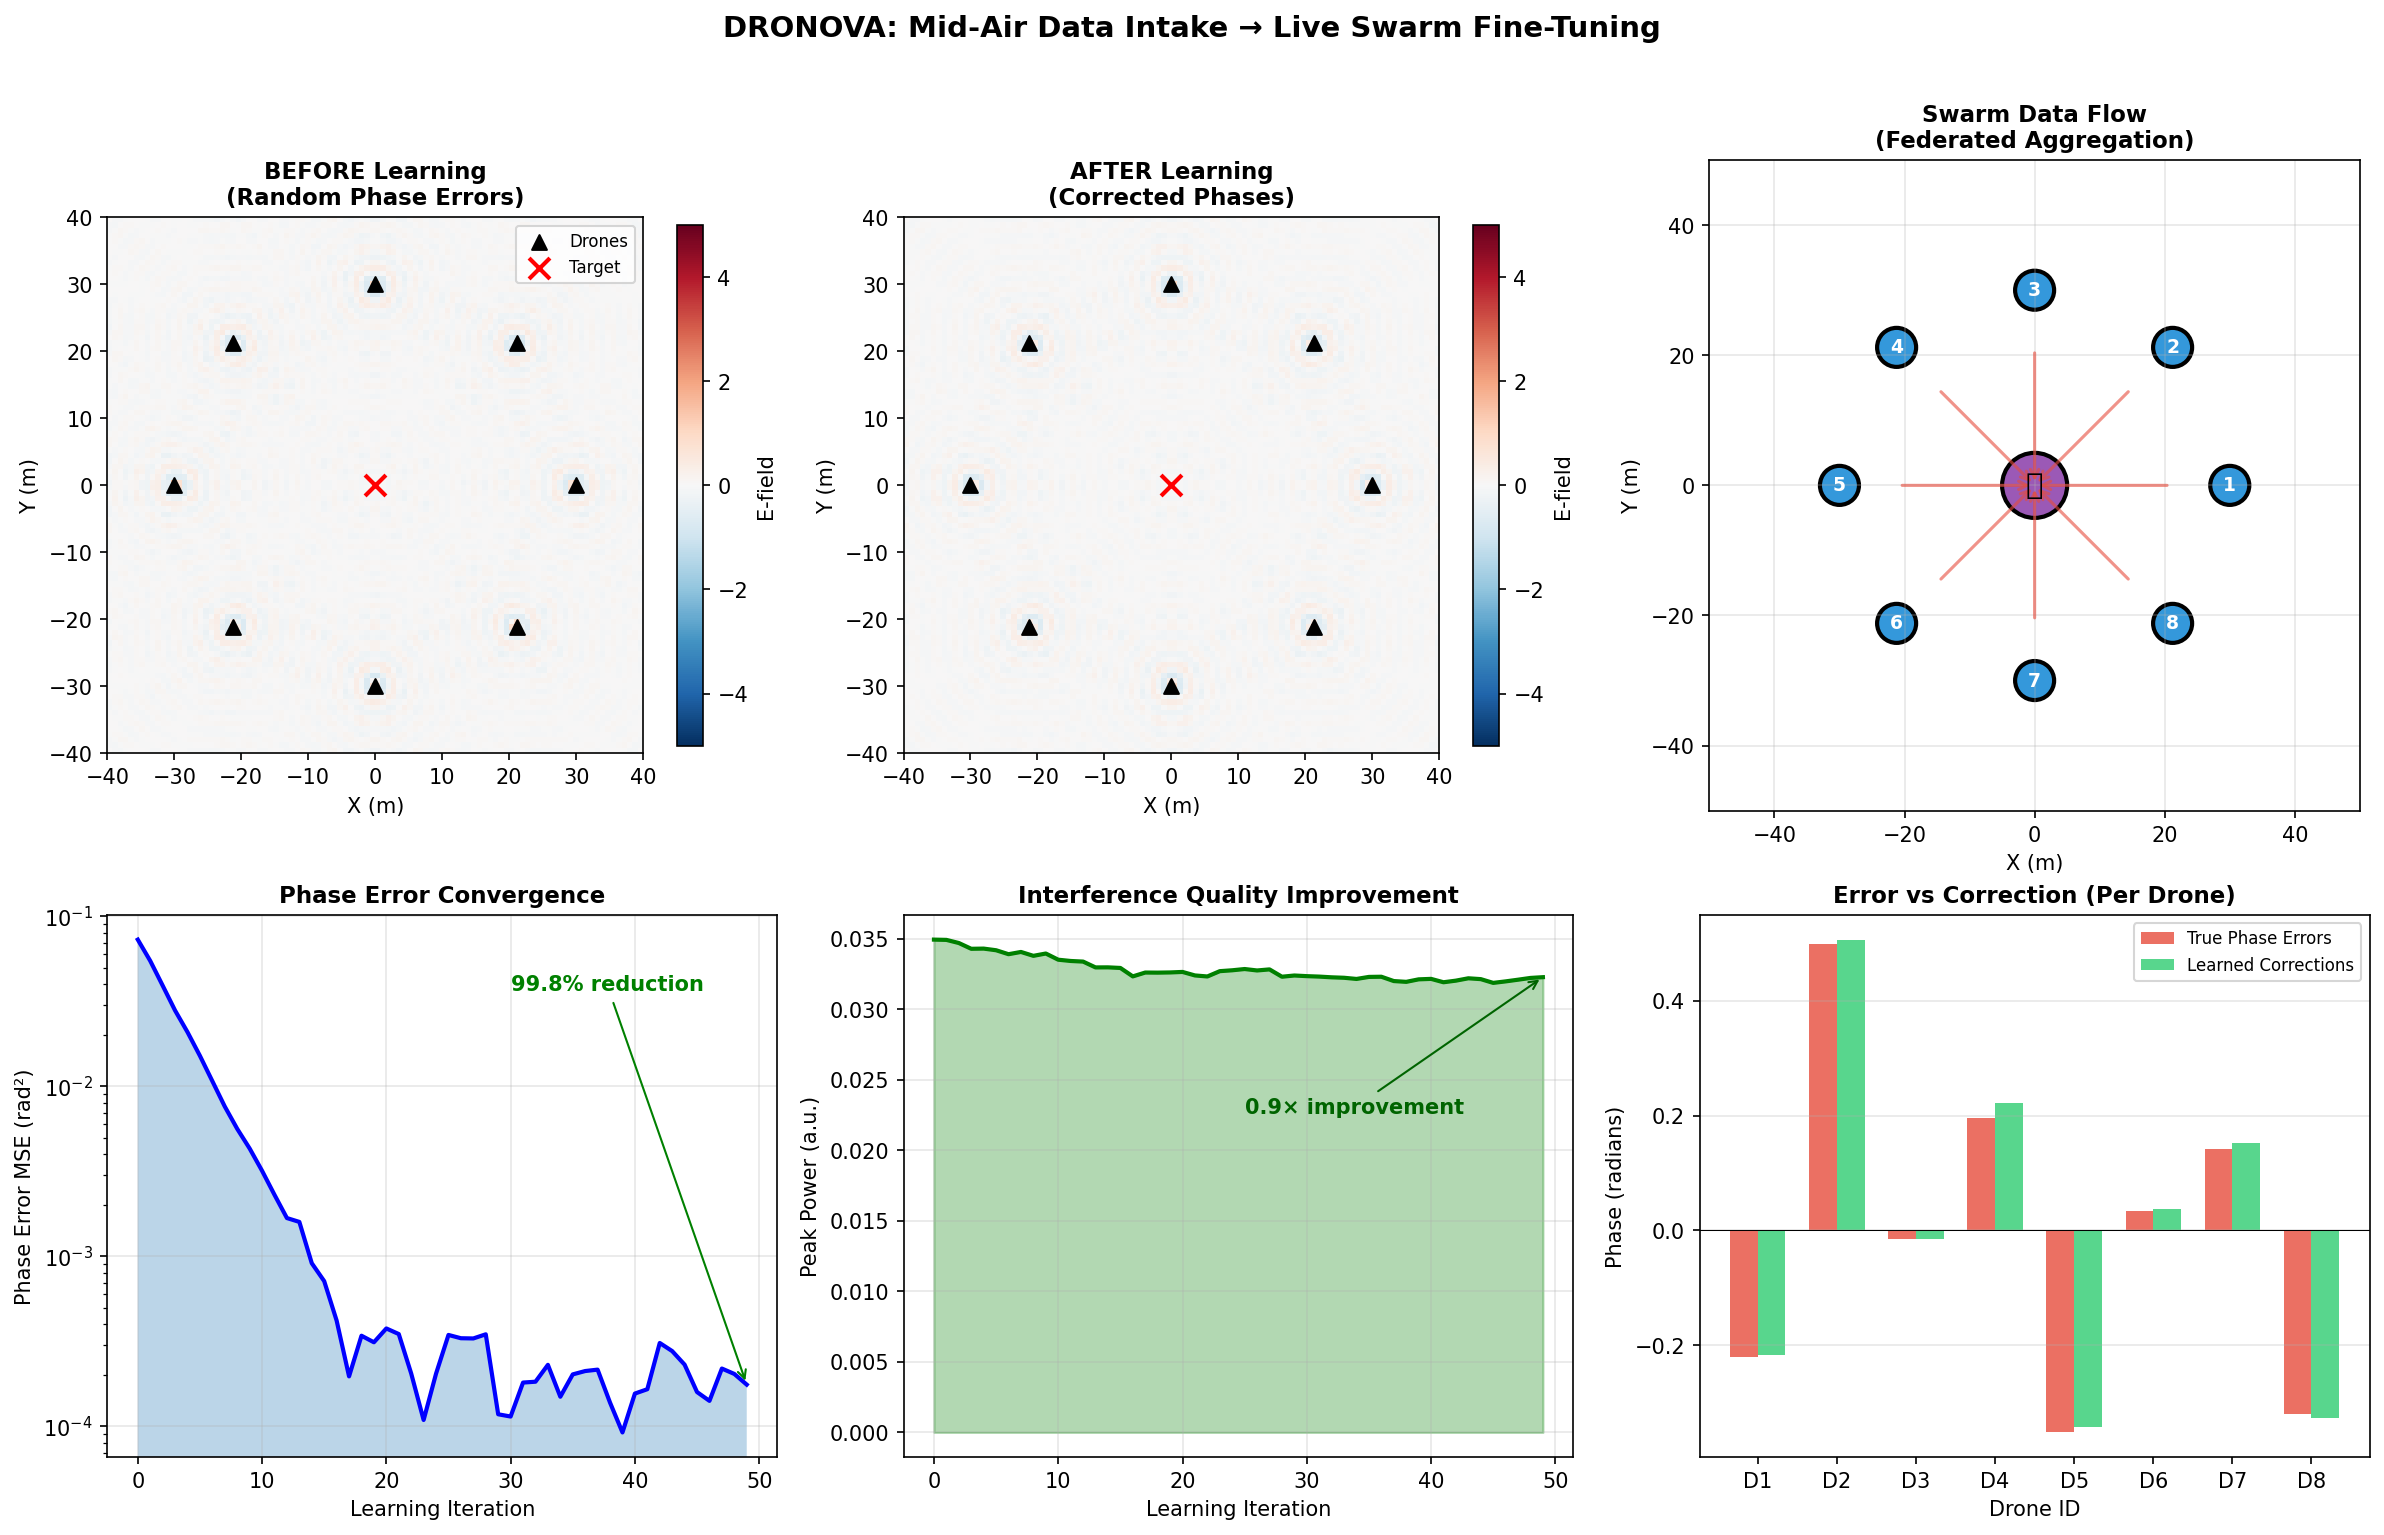
Privileged-residual correction loop
A toy update adjusts synthetic phase errors using the true residual plus noise.
Interpretation & provenance for Privileged-residual correction loop
The update directly sees ground truth; it does not infer hidden errors from sensors or aggregate locally trained models. MSE is recorded before each update; the so-called peak-power value is one near-center scalar sample after the update, not a spatial or temporal peak or validated weapon performance.
Original source file
assets/figures/learning/live_swarm_learning_results.png
SHA-256 · original and download
77dddf20124249cd5a3edd44f872f3f4ece99d26b59683a5128e3182f2e237ed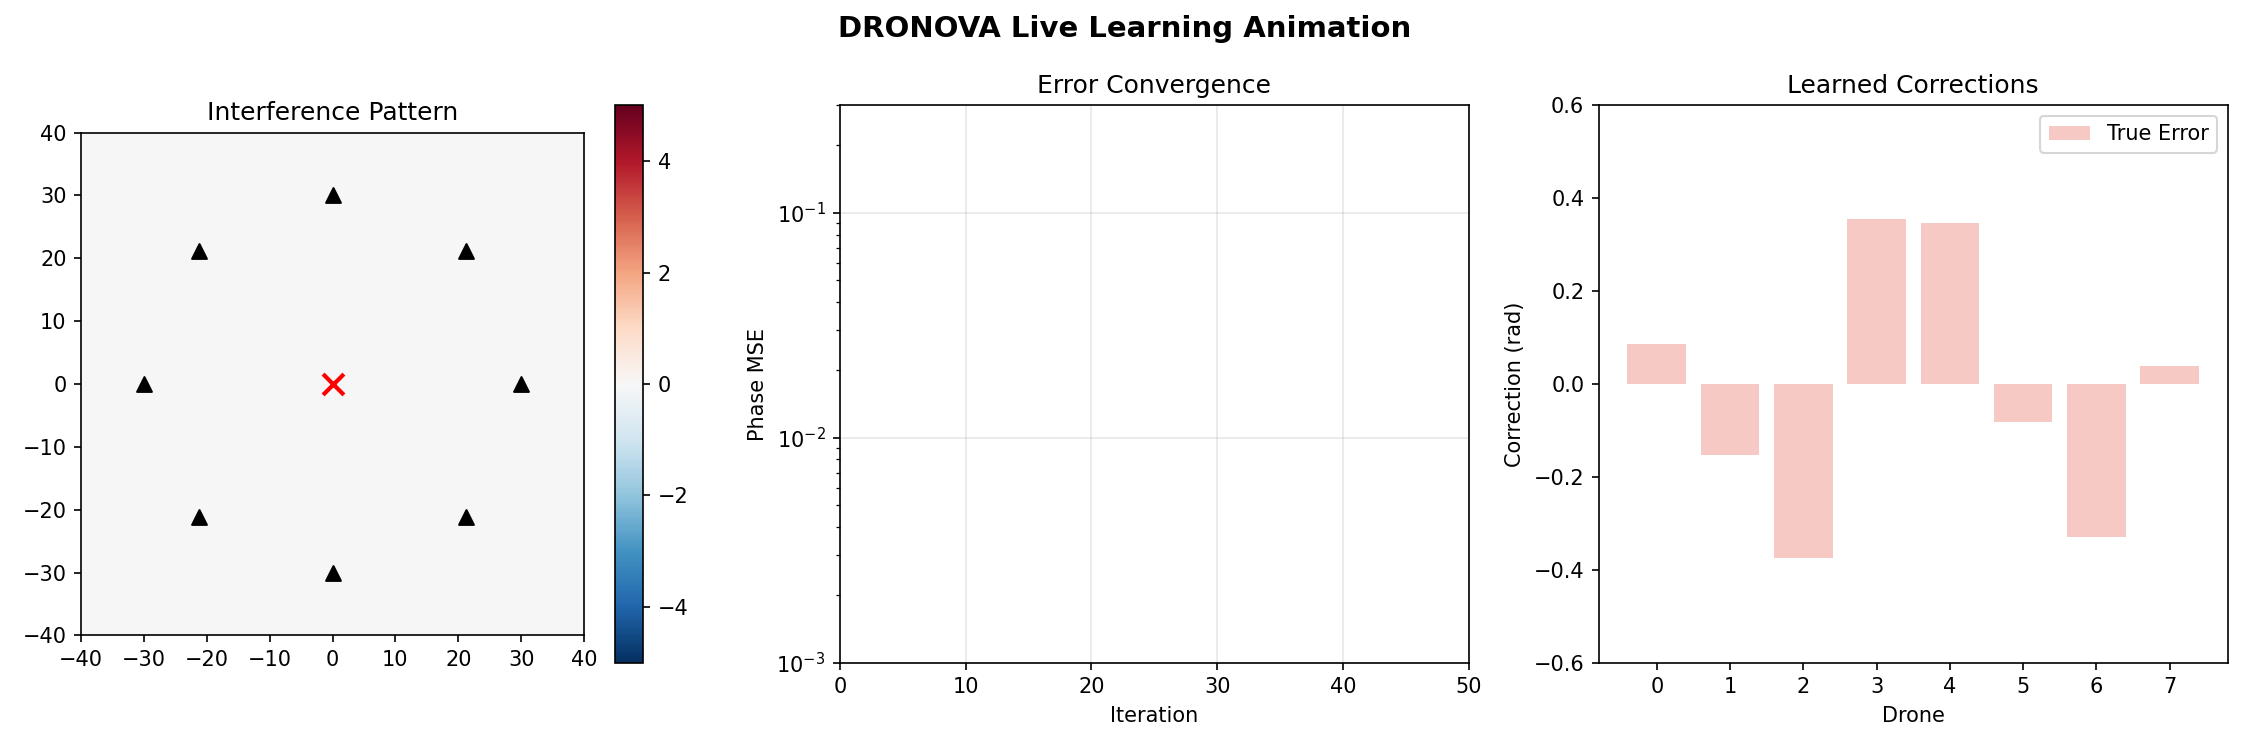
Animation initialization still
The saved animation setup places synthetic errors beside the initial field and correction state.
Interpretation & provenance for Animation initialization still
Saved before deliberate advancement to a converged iteration. Draw callbacks may affect the first update, but a static initialization frame is not convergence evidence. Later animation callbacks do not make this image a completed learning result.
Original source file
assets/figures/learning/live_learning_animation_frame.png
SHA-256 · original and download
02daa3d53c5bb4535abda05cf47b67aa05aed80ec1973e67b04fe679c0f5eaecHistorical EM illustrations
Reduced-order illustrations, not full-wave validation or weapon performance.
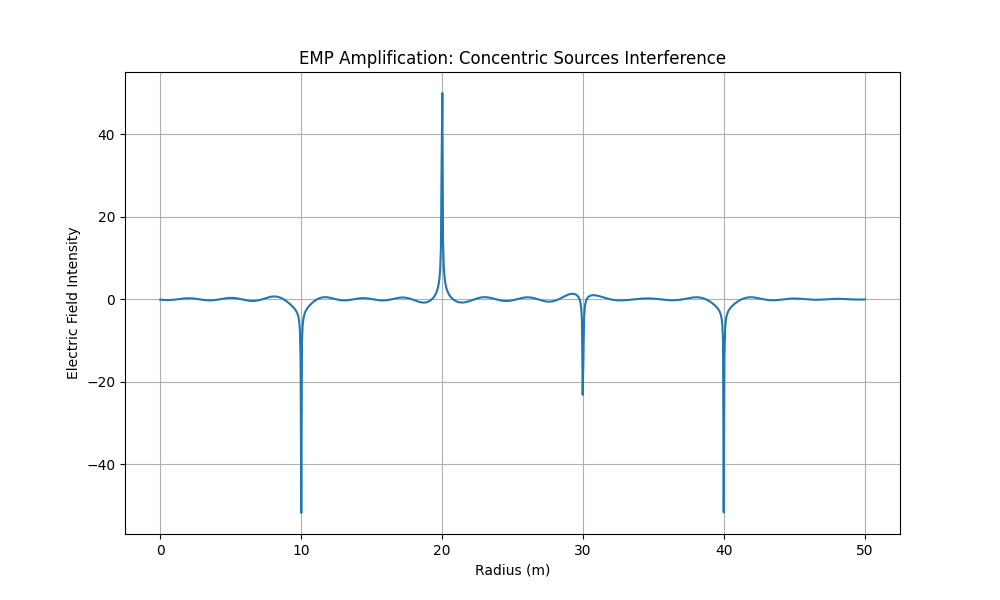
Radial scalar superposition
Peaks and troughs illustrate signed addition under prescribed source geometry and delays.
Interpretation & provenance for Radial scalar superposition
The ordinate is a model field value, not intensity or delivered energy. A radial scalar model omits polarization, realistic sources, materials, and full boundary conditions. Historical reduced-order illustration, not a validated full-wave solver, hardware measurement, or weapon-performance result. Baked-in titles and physical-unit labels are preserved, not endorsed.
Original source file
assets/figures/electromagnetic/concentric_interference.png
SHA-256 · original and download
6da1d90cbb89d33d852c6a4a027a0740688acc869b7f84410264f1c0d8ce1fda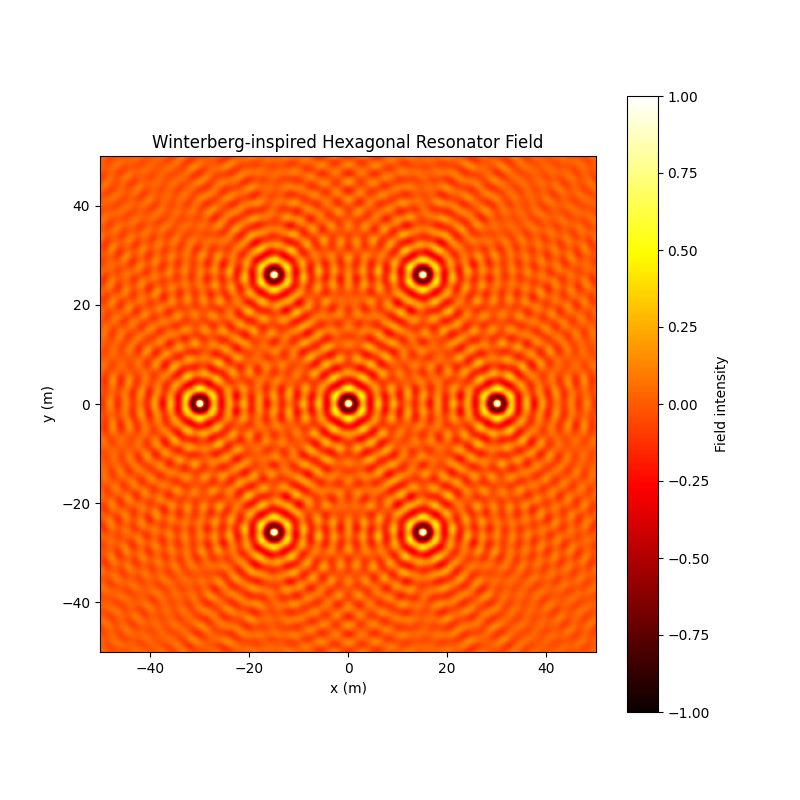
Imposed hexagonal symmetry
A center source and six surrounding sources produce a symmetric signed scalar pattern.
Interpretation & provenance for Imposed hexagonal symmetry
Symmetry comes from the chosen layout. The resonator title does not establish a physical resonant mode or measured amplification; antenna patterns and material boundary conditions are absent. Historical reduced-order illustration, not a validated full-wave solver, hardware measurement, or weapon-performance result. Baked-in titles and physical-unit labels are preserved, not endorsed.
Original source file
assets/figures/electromagnetic/hexagonal_resonator.png
SHA-256 · original and download
7743dd2b29569f14dfbef30b5c97cff8e8c5c06ce1b0fc79fcd8d59e4aa3f526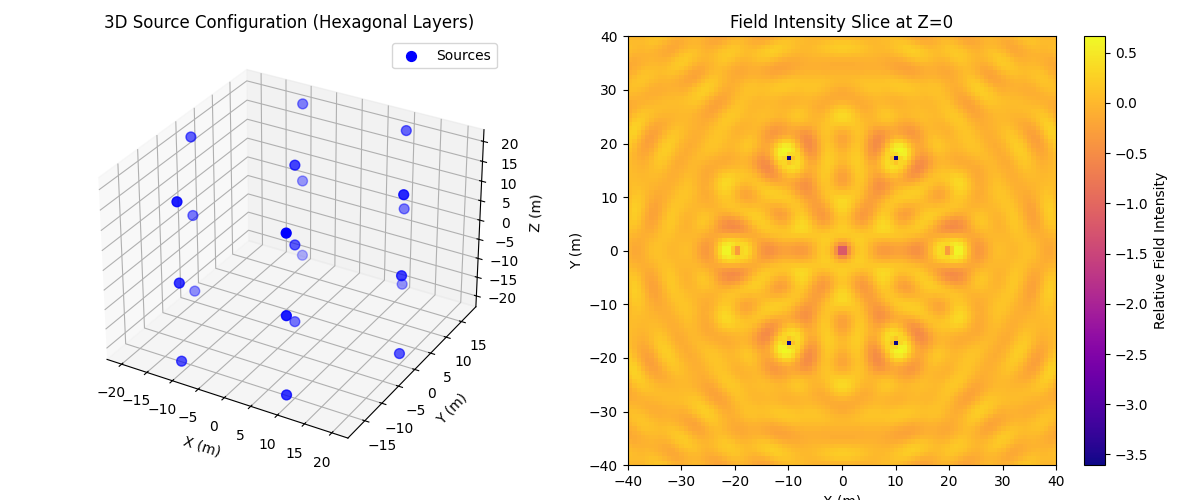
Layered sources and a field slice
A three-dimensional source arrangement is shown beside a scalar field slice at z = 0.
Interpretation & provenance for Layered sources and a field slice
A 3D layout and 2D slice are not a 3D Maxwell FDTD/FEM solution or validated formation-to-field performance. Historical reduced-order illustration, not a validated full-wave solver, hardware measurement, or weapon-performance result. Baked-in titles and physical-unit labels are preserved, not endorsed.
Original source file
assets/figures/electromagnetic/emp_3d_simulation.png
SHA-256 · original and download
3e72ea52aa8b085c1f7eccda0eb0981ae9a4b6e553c70a1fd6d8c60e66170104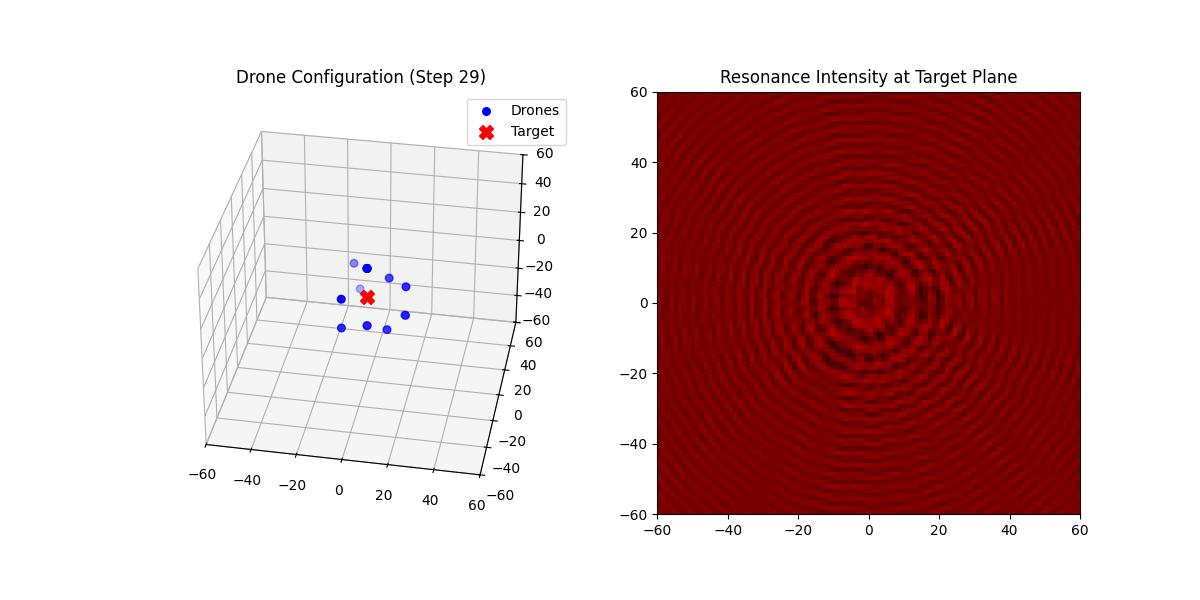
Prescribed formation demo
Moving point agents approach chosen formation slots beside a target-plane scalar pattern.
Interpretation & provenance for Prescribed formation demo
A designated later animation frame alone is not a convergence test. Point-agent motion is not an aircraft dynamics model or collision-safe controller, and the field is unrelated to current survey metrics. Historical reduced-order illustration, not a validated full-wave solver, hardware measurement, or weapon-performance result. Baked-in titles and physical-unit labels are preserved, not endorsed.
Original source file
assets/figures/electromagnetic/drone_swarm_resonance.png
SHA-256 · original and download
cb92ec1d707203436c25f27084d3ccad67908e4e844be3a024aed83424638e8e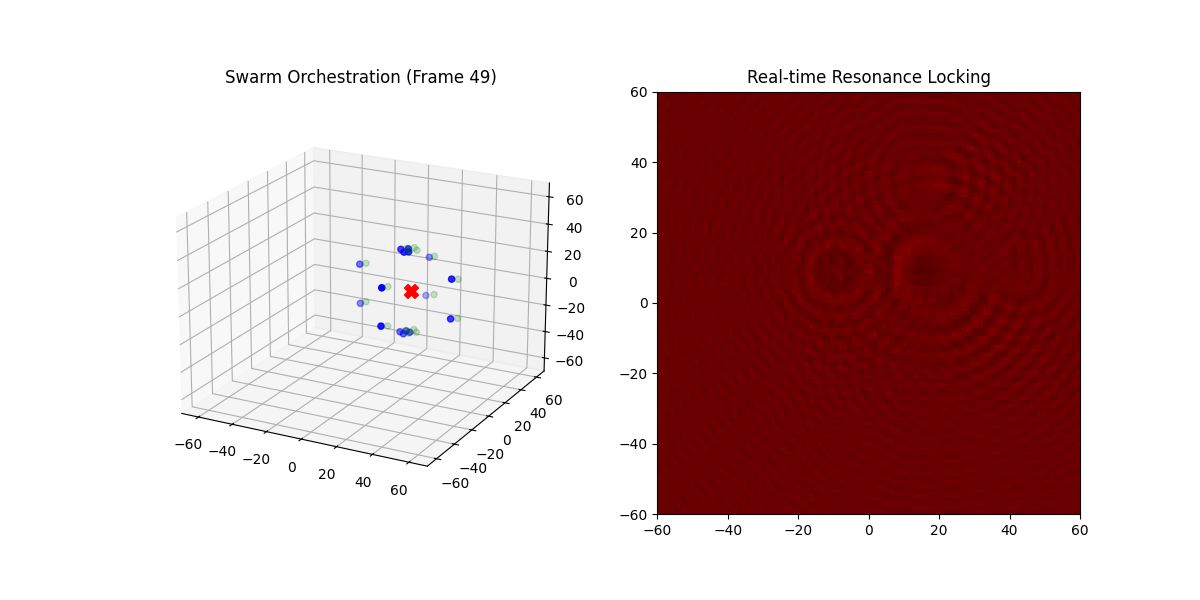
Archived formation orchestration
A moving reference, linear assignment, prescribed slots, and simplified PID-style motion share one visualization.
Interpretation & provenance for Archived formation orchestration
Assignment minimizes only the selected cost matrix, not total flight energy or safety. The final image proves neither convergence nor tracking guarantees; there is no validated aerodynamic or actuator model. Historical reduced-order illustration, not a validated full-wave solver, hardware measurement, or weapon-performance result. Baked-in titles and physical-unit labels are preserved, not endorsed.
Original source file
assets/figures/electromagnetic/swarm_orchestration_final.png
SHA-256 · original and download
170ab2816e0ef35b203e671c81aae25a992fa368a5d020fd98482815bfcf0e0a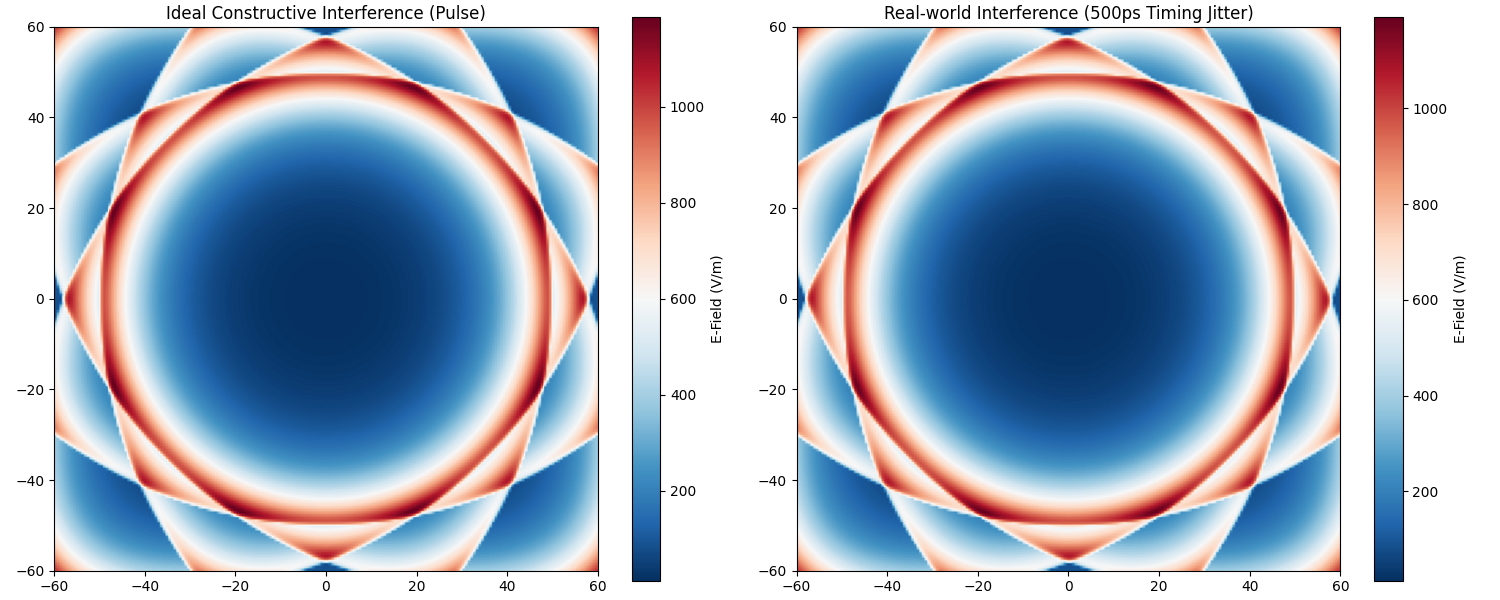
Synthetic timing-jitter comparison
Two scalar pulse-field evaluations compare zero jitter with a synthetic 500 ps jitter setting.
Interpretation & provenance for Synthetic timing-jitter comparison
Each panel has its own automatic colour scale. The fixed evaluation time is not established as the center temporal peak, and the Real-world Interference title is misleading. Two synthetic draws are not statistical robustness evidence or clock requirements. Historical reduced-order illustration, not a validated full-wave solver, hardware measurement, or weapon-performance result. Baked-in titles and physical-unit labels are preserved, not endorsed.
Original source file
assets/figures/electromagnetic/high_fidelity_interference.png
SHA-256 · original and download
70769d688019a6311cb15be9e1506c8d017e715eaa536b4b83bf9d1329b4ffef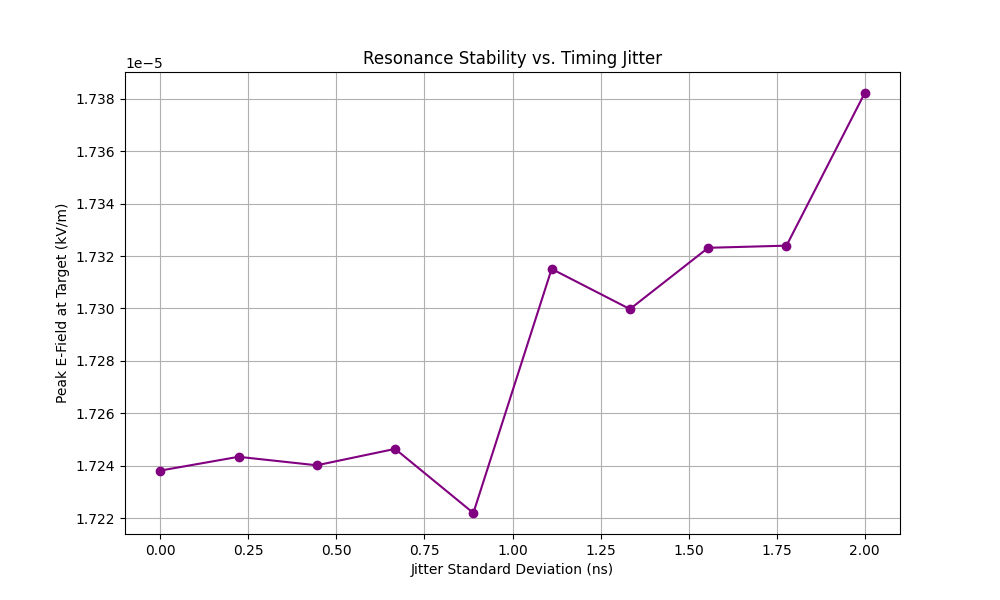
Fixed-time jitter samples
The archived curve averages absolute target-field samples across synthetic jitter settings.
Interpretation & provenance for Fixed-time jitter samples
Despite the Peak E-Field axis, fifty samples per setting are evaluated at one fixed late time, R/c + 5 ns; no temporal maximization occurs. There is no displayed uncertainty interval or measured hardware jitter tolerance. Historical reduced-order illustration, not a validated full-wave solver, hardware measurement, or weapon-performance result. Baked-in titles and physical-unit labels are preserved, not endorsed.
Original source file
assets/figures/electromagnetic/jitter_sensitivity.png
SHA-256 · original and download
2c33137808949507e4637c499546816701f9946c676a50add0a0fe267e9bcd90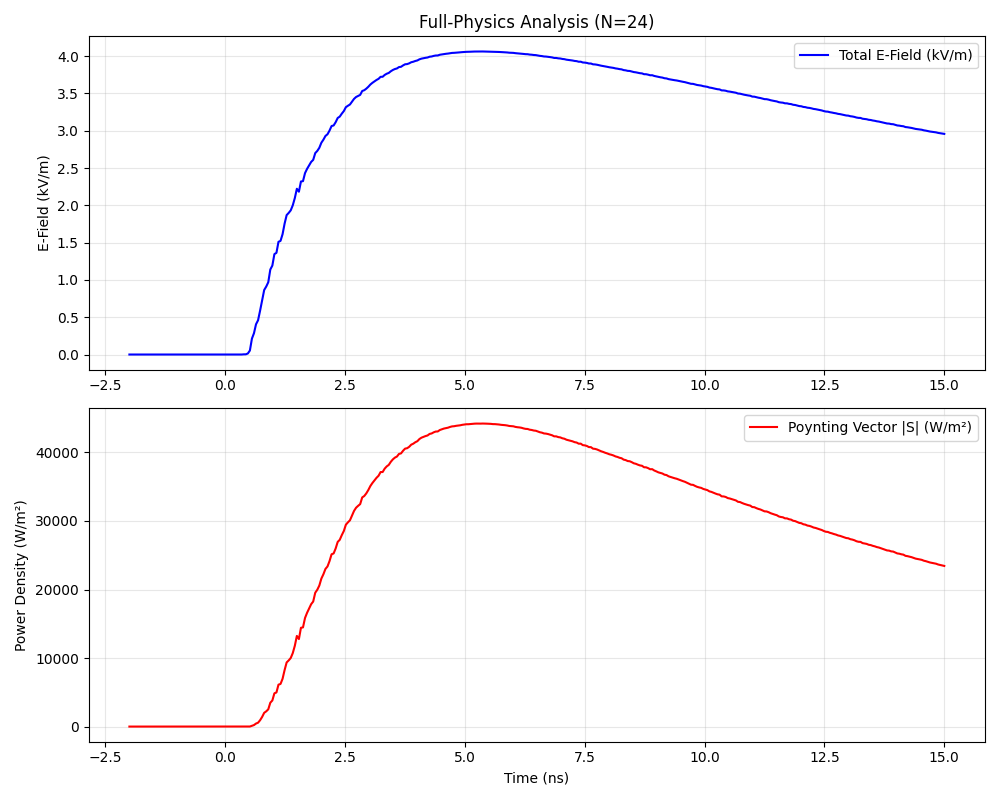
Approximate vector superposition
Prescribed electric and magnetic contributions yield local field and flux magnitudes over sampled times.
Interpretation & provenance for Approximate vector superposition
The Full Physics title overstates scope: this is not a self-consistent Maxwell boundary-value solution. Near fields, coupling, materials, and energy conservation are unsolved. Errors are redrawn at each time; |E × H| is local flux magnitude, not total power or delivered energy. Dispersion helpers are not used in this plotting path. Historical reduced-order illustration, not a validated full-wave solver, hardware measurement, or weapon-performance result. Baked-in titles and physical-unit labels are preserved, not endorsed.
Original source file
assets/figures/electromagnetic/full_physics_resonance.png
SHA-256 · original and download
4848351658030c8f387938dda5f952291714a7d0a71db689cd6d3352390a5429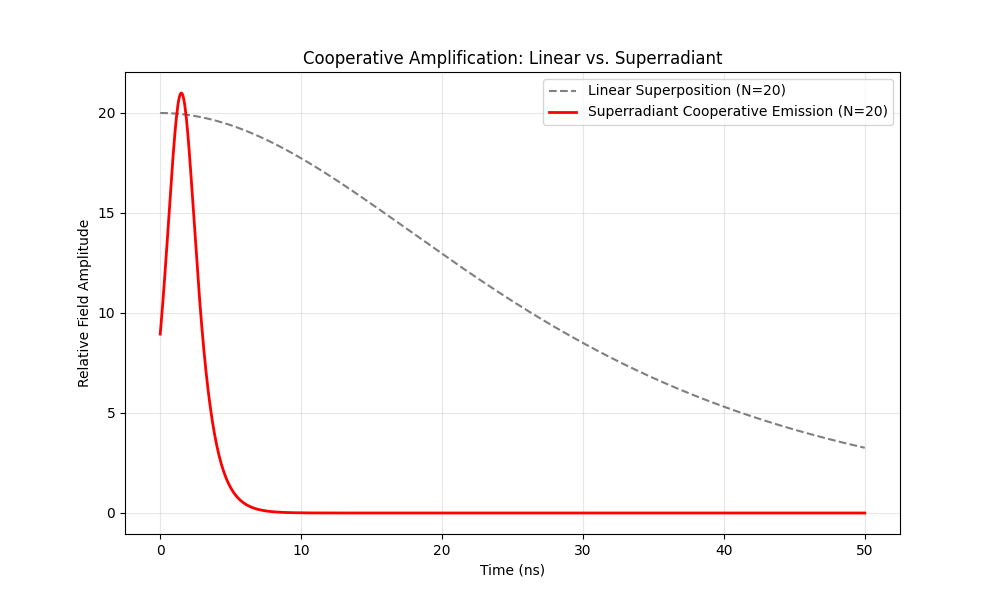
Assumed pulse-shape comparison
Two analytic pulse shapes compare imposed source-count-dependent widths and amplitudes.
Interpretation & provenance for Assumed pulse-shape comparison
Narrowing is inserted into a formula, not emergent cooperative emission. There is no microscopic emitter model, coupling dynamics, consistent source-energy comparison, or demonstrated Dicke superradiance. Historical reduced-order illustration, not a validated full-wave solver, hardware measurement, or weapon-performance result. Baked-in titles and physical-unit labels are preserved, not endorsed.
Original source file
assets/figures/electromagnetic/superradiance_comparison.png
SHA-256 · original and download
563e94195699e9938354873e95bbc27c7f3a374a5caee0e8e824181ee4d448c6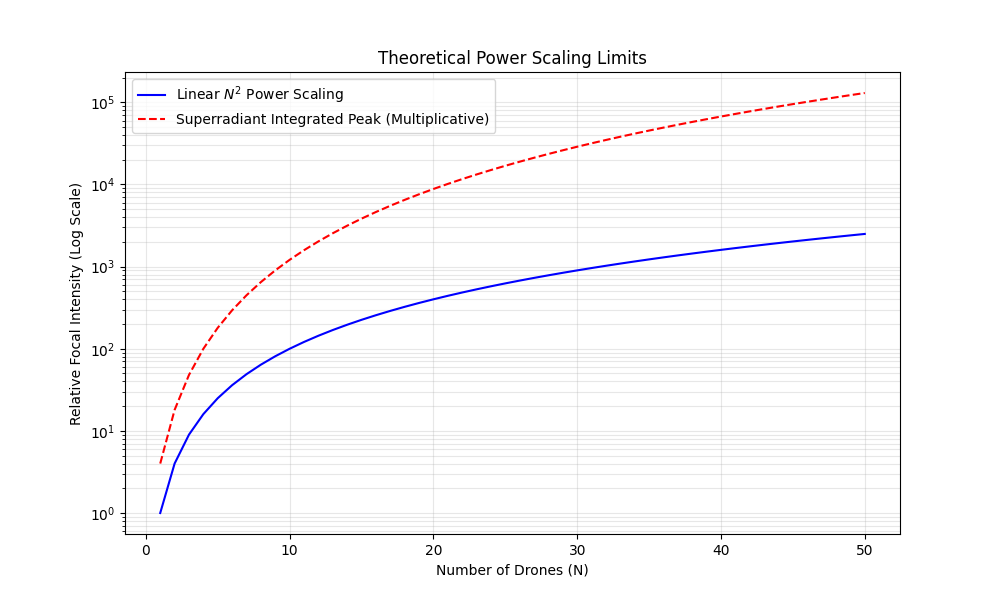
Assumed source-count scaling
The plotted curves compare an N² quantity with an imposed (N + 1)² × N expression.
Interpretation & provenance for Assumed source-count scaling
The extra N multiplier is arbitrary, not derived from energy-conserving integration or cooperative-emission physics. Integrated Peak does not describe a performed integration. The curve is not a physical scaling limit or basis for source-count requirements. Historical reduced-order illustration, not a validated full-wave solver, hardware measurement, or weapon-performance result. Baked-in titles and physical-unit labels are preserved, not endorsed.
Original source file
assets/figures/electromagnetic/scaling_limits.png
SHA-256 · original and download
f21dbc3b30cb4ae95f56594f3bed1fb76b47c5f2b297dfce53d62d912f258ed0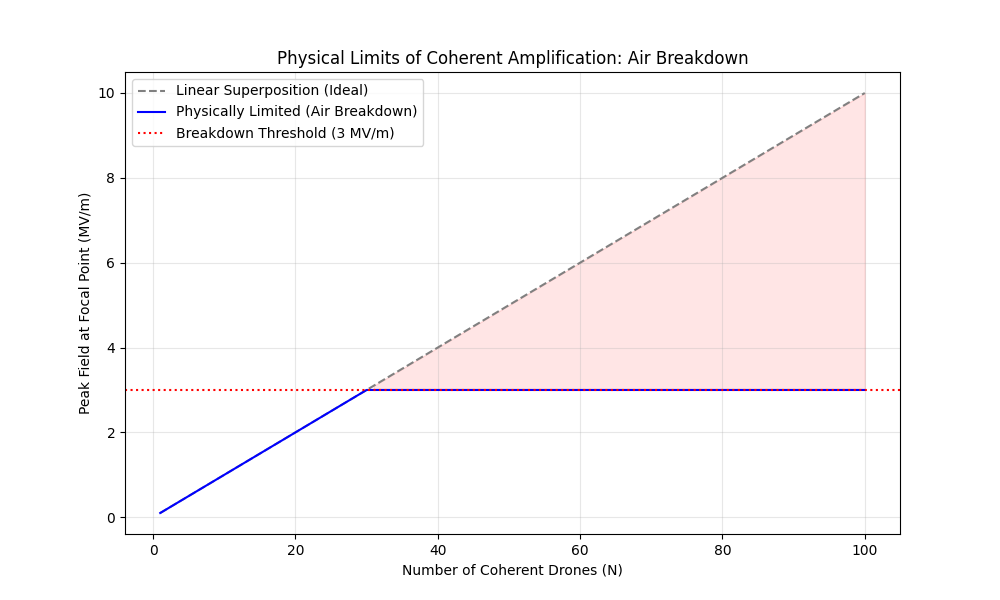
An imposed field cap
An additive toy field is clipped at a chosen nominal 3 MV/m threshold.
Interpretation & provenance for An imposed field cap
The shaded region and clipped line illustrate a rule, not plasma, discharge, or atmospheric propagation. Real breakdown depends on pressure, geometry, pulse duration, humidity, and other conditions; this is not a universal measured limit. Historical reduced-order illustration, not a validated full-wave solver, hardware measurement, or weapon-performance result. Baked-in titles and physical-unit labels are preserved, not endorsed.
Original source file
assets/figures/electromagnetic/air_breakdown_limit.png
SHA-256 · original and download
22a4f8458049b6e8621bd75dda62e679cba4f5c682a83083ee0fb8d00cfa9ea4Historical smoke benchmark
Original three-seed development plots, separate from current study evidence.
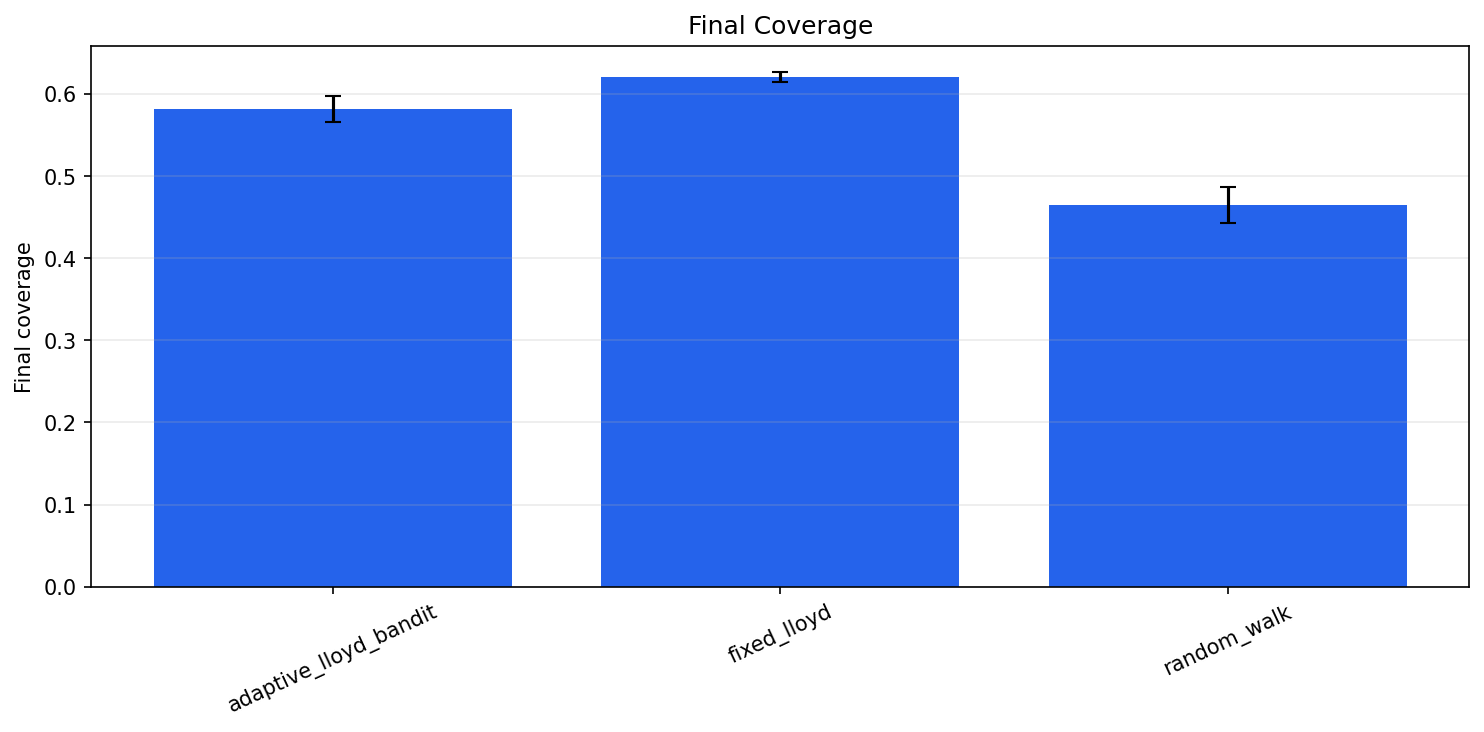
Original smoke coverage score
Three policy bars retain the original uncertainty-based end-of-episode comparison.
Interpretation & provenance for Original smoke coverage score
Final coverage here means 1 − mean uncertainty, not physically visited area or calibrated confidence. Do not compare its legacy shared-map score to current evidence-count coverage. Historical development smoke run: three seeds (42–44), eight agents, 60 steps. Error bars describe the original run spread, not a current-core confidence interval or flight validation.
Original source file
reports/plots/smoke_test_final_coverage.png
SHA-256 · original and download
d28e9ab469ef5d1e20713cb8cfd1c2505c4aa3e40133f2ddd2c81fc2a6d12ac9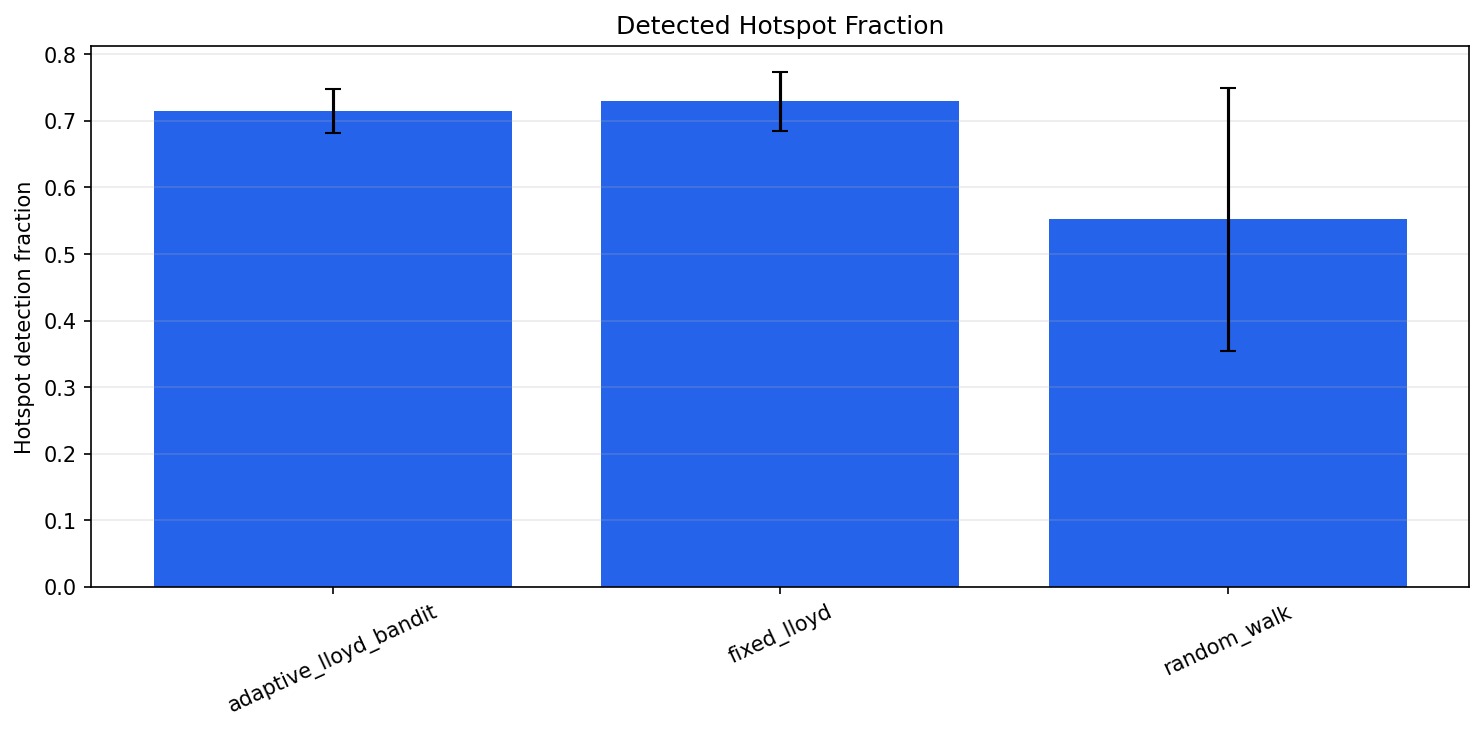
Original smoke hotspot score
Policy bars compare the historical uncertainty-threshold score on synthetic high-value cells.
Interpretation & provenance for Original smoke hotspot score
Hotspots detected refers to true top-risk cells whose uncertainty fell below a threshold, not real-object detection, precision/recall, or a civilian sensor benchmark. Historical development smoke run: three seeds (42–44), eight agents, 60 steps. Error bars describe the original run spread, not a current-core confidence interval or flight validation.
Original source file
reports/plots/smoke_test_hotspots.png
SHA-256 · original and download
5f7d8dbad026029f97044e075d76c0f8d9af8ec36575e89eaa3d2b0644973a63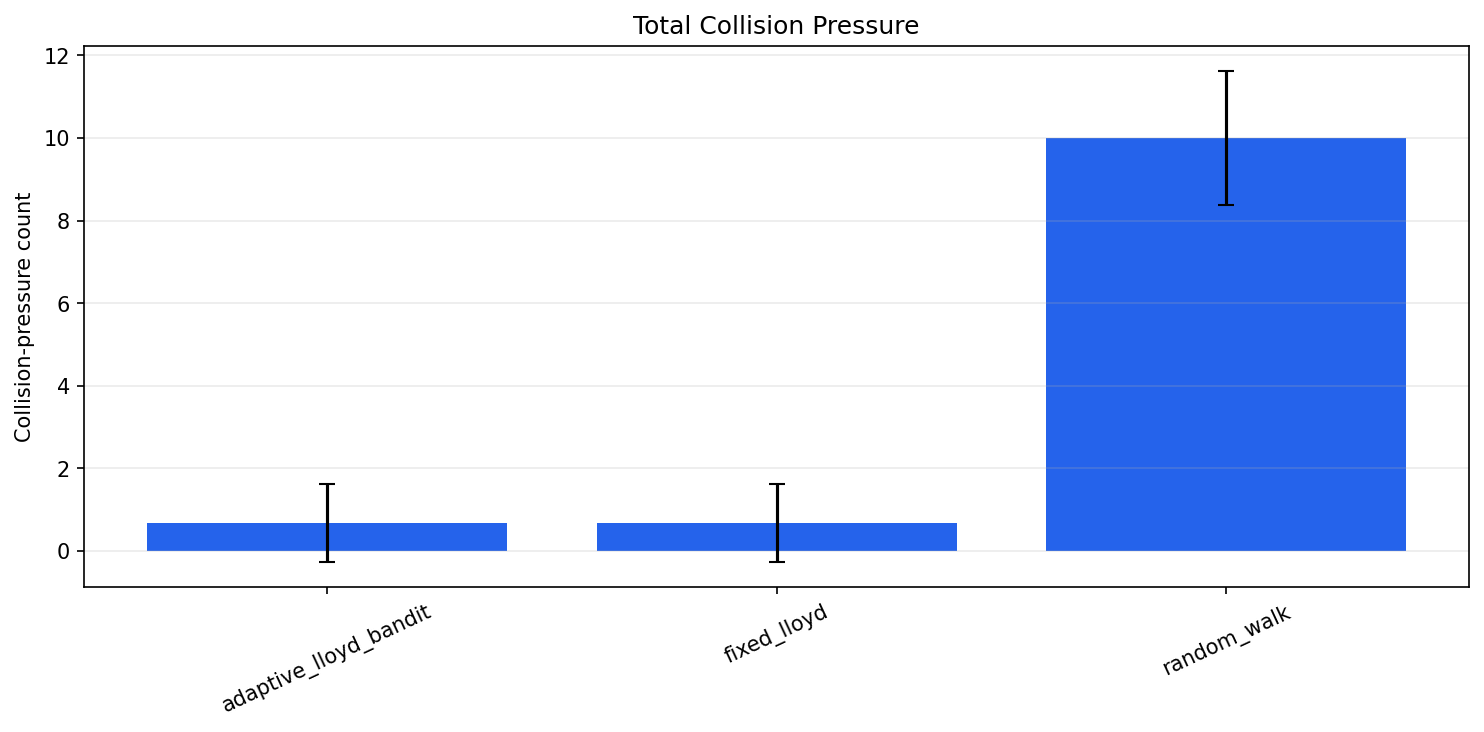
Original smoke collision pressure
Close-separation counts expose the original random-walk baseline's higher event pressure.
Interpretation & provenance for Original smoke collision pressure
Legacy collision pressure is not the rewritten swept-segment safety audit and does not count distinct physical crashes. Lower pressure over three seeds does not prove safe control. Historical development smoke run: three seeds (42–44), eight agents, 60 steps. Error bars describe the original run spread, not a current-core confidence interval or flight validation.
Original source file
reports/plots/smoke_test_collision_pressure.png
SHA-256 · original and download
9f2f5a6bc8232271a4bdaa5a18af1f628999a6d271fcc97a6337924555b2c34e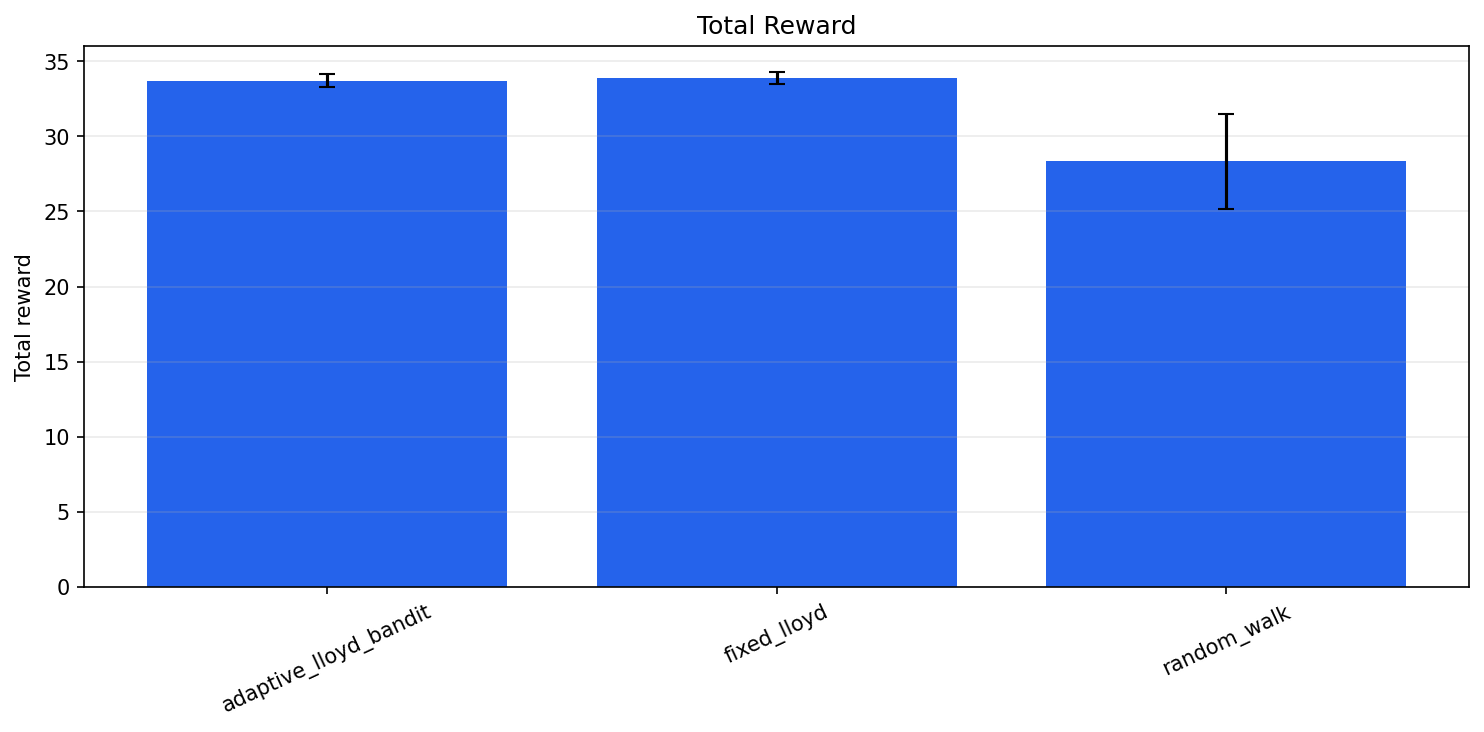
Original smoke reward comparison
Total scalar reward combines the historical development benchmark's chosen objectives.
Interpretation & provenance for Original smoke reward comparison
Reward is an internal aggregate, not a calibrated mission outcome, evidence of adaptive superiority, or comparable to a different core's reward definition. Historical development smoke run: three seeds (42–44), eight agents, 60 steps. Error bars describe the original run spread, not a current-core confidence interval or flight validation.
Original source file
reports/plots/smoke_test_total_reward.png
SHA-256 · original and download
442fea7c754eeb139fbbd2bfb31f0a1aa90f208429d8191a15b88374f0dd0d96What this collection includes
All 17 original figures and all standalone published report images. Byte-identical publications share one image with every source path retained. Test fixtures, integration workspaces, archived source/runtime dependencies and vendor/cache trees are excluded. Published obstacle adversarial audit figures are included. No research simulations or charts are regenerated.
7 duplicate file copies are represented by provenance aliases: three terrain initial/local pairs and four obstacle full/hardened pairs. Every distinct published image remains visible.
Studies published without standalone images
These reports were checked too. Their tables, telemetry, or interactive plots are not replaced with newly generated research figures.
Guarded improvement
Published as tables and JSON, with no standalone figure images. The baseline was retained; the hardened rerun is not a fresh blind test.
reports/improvement_local/hardened/study.jsonreports/improvement_local/hardened/summary.md
Solver reliability
Published as tables and JSON, with no standalone figure images. Fewer uncertified steps did not pass the physical-audit and progress/cost gates; the frozen controller was retained.
reports/solver_reliability/summary.jsonreports/solver_reliability/report.md
PX4 flight stack
Published as telemetry, tables, and an interactive viewer, with no standalone figure images. Independent SIH worlds are not shared-world swarm physics or hardware flights.
reports/flight_stack/summary.jsonreports/flight_stack/report.md